
Maysville, Missouri facts for kids
Quick facts for kids
Maysville, Missouri
|
|
|---|---|

Aerial view of Maysville, Missouri
|
|

Location of Maysville, Missouri
|
|
| Country | United States |
| State | Missouri |
| County | DeKalb |
| Area | |
| • Total | 1.15 sq mi (2.98 km2) |
| • Land | 1.15 sq mi (2.97 km2) |
| • Water | 0.01 sq mi (0.01 km2) |
| Elevation | 935 ft (285 m) |
| Population
(2020)
|
|
| • Total | 1,095 |
| • Density | 955.50/sq mi (369.04/km2) |
| Time zone | UTC-6 (Central (CST)) |
| • Summer (DST) | UTC-5 (CDT) |
| ZIP code |
64469
|
| Area code(s) | 816 |
| FIPS code | 29-46946 |
| GNIS feature ID | 2395055 |
Maysville is a city located in DeKalb County, Missouri, in the United States. It is the main city and the county seat of DeKalb County. In 2020, about 1,095 people lived there. Maysville is also part of the larger St. Joseph metropolitan area.
Contents
History of Maysville
Maysville was started in 1845. It might have been named after a place called Maysville in Kentucky. A post office opened in Maysville in 1846 and has been serving the community ever since.
The DeKalb County Courthouse is an important building in Maysville. It was added to the National Register of Historic Places in 1998. This means it's a special place recognized for its history.
Geography and Location
Maysville is in the middle of DeKalb County. You can find it where two main roads, Missouri Route 6 and Missouri Route 33, meet.
The city covers a total area of about 1.16 square miles (2.98 square kilometers). Most of this area is land, with a very small part being water.
Maysville's Climate
Maysville has a climate with four different seasons. Summers are usually warm, and winters are cold. The city gets a good amount of rain throughout the year. You can see more details about the weather in the table below.
| Climate data for Maysville, Missouri (1991–2020 normals, extremes 1946–2022) | |||||||||||||
|---|---|---|---|---|---|---|---|---|---|---|---|---|---|
| Month | Jan | Feb | Mar | Apr | May | Jun | Jul | Aug | Sep | Oct | Nov | Dec | Year |
| Record high °F (°C) | 69 (21) |
77 (25) |
85 (29) |
92 (33) |
98 (37) |
101 (38) |
111 (44) |
105 (41) |
105 (41) |
94 (34) |
82 (28) |
73 (23) |
111 (44) |
| Mean maximum °F (°C) | 58.7 (14.8) |
64.0 (17.8) |
76.1 (24.5) |
83.5 (28.6) |
88.5 (31.4) |
93.1 (33.9) |
97.2 (36.2) |
96.9 (36.1) |
91.9 (33.3) |
85.0 (29.4) |
71.8 (22.1) |
62.3 (16.8) |
98.7 (37.1) |
| Mean daily maximum °F (°C) | 34.4 (1.3) |
39.6 (4.2) |
51.8 (11.0) |
62.9 (17.2) |
72.8 (22.7) |
82.3 (27.9) |
86.5 (30.3) |
85.1 (29.5) |
77.7 (25.4) |
65.3 (18.5) |
51.0 (10.6) |
39.0 (3.9) |
62.4 (16.9) |
| Daily mean °F (°C) | 24.7 (−4.1) |
29.2 (−1.6) |
40.5 (4.7) |
51.4 (10.8) |
61.9 (16.6) |
71.8 (22.1) |
75.9 (24.4) |
74.1 (23.4) |
65.9 (18.8) |
53.7 (12.1) |
40.7 (4.8) |
29.7 (−1.3) |
51.6 (10.9) |
| Mean daily minimum °F (°C) | 15.1 (−9.4) |
18.8 (−7.3) |
29.2 (−1.6) |
39.8 (4.3) |
51.1 (10.6) |
61.3 (16.3) |
65.3 (18.5) |
63.0 (17.2) |
54.1 (12.3) |
42.1 (5.6) |
30.3 (−0.9) |
20.5 (−6.4) |
40.9 (4.9) |
| Mean minimum °F (°C) | −4.6 (−20.3) |
1.1 (−17.2) |
10.7 (−11.8) |
25.9 (−3.4) |
37.7 (3.2) |
50.4 (10.2) |
56.6 (13.7) |
53.9 (12.2) |
40.0 (4.4) |
27.7 (−2.4) |
14.6 (−9.7) |
2.3 (−16.5) |
−8.6 (−22.6) |
| Record low °F (°C) | −24 (−31) |
−19 (−28) |
−17 (−27) |
9 (−13) |
27 (−3) |
39 (4) |
43 (6) |
40 (4) |
27 (−3) |
17 (−8) |
−7 (−22) |
−32 (−36) |
−32 (−36) |
| Average precipitation inches (mm) | 1.05 (27) |
1.48 (38) |
2.47 (63) |
3.89 (99) |
5.65 (144) |
5.35 (136) |
4.64 (118) |
4.41 (112) |
4.03 (102) |
3.28 (83) |
2.02 (51) |
1.61 (41) |
39.88 (1,013) |
| Average snowfall inches (cm) | 5.3 (13) |
5.6 (14) |
2.0 (5.1) |
0.5 (1.3) |
0.0 (0.0) |
0.0 (0.0) |
0.0 (0.0) |
0.0 (0.0) |
0.0 (0.0) |
0.3 (0.76) |
1.5 (3.8) |
5.5 (14) |
20.7 (53) |
| Average precipitation days (≥ 0.01 in) | 4.9 | 5.3 | 7.5 | 10.0 | 10.9 | 10.1 | 8.9 | 7.8 | 7.4 | 7.7 | 6.2 | 5.4 | 92.1 |
| Average snowy days (≥ 0.1 in) | 2.9 | 2.5 | 1.2 | 0.4 | 0.0 | 0.0 | 0.0 | 0.0 | 0.0 | 0.2 | 0.7 | 2.5 | 10.4 |
| Source: NOAA | |||||||||||||
Population and People
The population of Maysville has changed over the years. Here's how the number of people living in the city has grown and shrunk:
| Historical population | |||
|---|---|---|---|
| Census | Pop. | %± | |
| 1880 | 418 | — | |
| 1890 | 717 | 71.5% | |
| 1900 | 925 | 29.0% | |
| 1910 | 1,051 | 13.6% | |
| 1920 | 1,057 | 0.6% | |
| 1930 | 946 | −10.5% | |
| 1940 | 1,026 | 8.5% | |
| 1950 | 973 | −5.2% | |
| 1960 | 942 | −3.2% | |
| 1970 | 1,045 | 10.9% | |
| 1980 | 1,187 | 13.6% | |
| 1990 | 1,176 | −0.9% | |
| 2000 | 1,212 | 3.1% | |
| 2010 | 1,114 | −8.1% | |
| 2020 | 1,095 | −1.7% | |
| U.S. Decennial Census | |||
What the 2010 Census Showed
In 2010, there were 1,114 people living in Maysville. These people lived in 433 households. About 33% of these households had children under 18. The average age of people in Maysville was about 39 years old.
Most people in Maysville were White (97.6%). A small number of people were African American, Native American, or Asian.
Education in Maysville
Students in Maysville go to schools within the R-1 school district. This includes R-1 Elementary School for younger students and Maysville R-1 Jr./Sr. High School for older students.
Images for kids
-
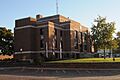
The DeKalb County Courthouse in Maysville, seen from the southwest.
.JPG)
See also
 In Spanish: Maysville (Misuri) para niños
