McGill, Nevada facts for kids
Quick facts for kids
McGill, Nevada
|
|
|---|---|

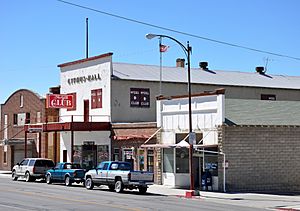
Downtown McGill
|
|

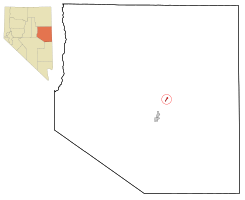
Location of McGill, Nevada
|
|
| Country | United States |
| State | Nevada |
| Area | |
| • Total | 1.21 sq mi (3.13 km2) |
| • Land | 1.21 sq mi (3.13 km2) |
| • Water | 0.00 sq mi (0.00 km2) |
| Elevation | 6,247 ft (1,904 m) |
| Population
(2020)
|
|
| • Total | 1,010 |
| • Density | 834.71/sq mi (322.30/km2) |
| Time zone | UTC-8 (Pacific (PST)) |
| • Summer (DST) | UTC-7 (PDT) |
| ZIP code |
89318
|
| Area code(s) | 775 |
| FIPS code | 32-44200 |
| GNIS feature ID | 2408199 |
McGill is a small community in White Pine County, Nevada, in the United States. It is called a census-designated place (CDP), which means it's an area set up for counting people by the government. In 2020, about 1,010 people lived there.
Contents
History of McGill
Early Days and the Ranch
In 1872, a man named John Cowger started a ranch in the Steptoe Valley. He also got the rights to the water in that area. Later, in 1886, William Lyons and William McGill bought the ranch from him. A post office was opened at the ranch in 1891, and it became known as McGill Ranch.
The Smelter and Copper Mining
A large company called Nevada Consolidated Copper Company had many mines nearby. They needed a partner to build a "smelter" in the area. A smelter is a factory that heats up metal ore to take out the pure metal, like copper. The Cumberland and Ely Mining Corporation owned land near the ranch. They thought it was a great spot for a smelter because there was plenty of water.
So, these two companies joined together. They formed a new company called the Steptoe Valley Smelting and Mining Company.
Building the Smelter and Town Growth
In 1906, they built a 9-mile (14 km) pipeline. This pipeline brought water from Duck Creek to big storage tanks near where the smelter would be. Construction on the smelter began soon after. The smelter was finished and started working on May 15, 1908. The first copper was shipped out on August 7 of the same year.
For a short time, the town was called Smelter. But then it was renamed McGill, after the ranch. The town grew quickly! In 1910, 1,904 people lived there, and by 1920, the population was 2,864.
Changes and Closure
In 1932, a company called Kennecott Utah Copper bought Nevada Consolidated Copper Company. This included the Steptoe Valley Smelting and Mining Company and the smelter in McGill. Until the 1950s, McGill was a "company town." This means Kennecott owned most of the homes and businesses in the town.
In the 1950s, Kennecott started selling the houses and businesses to individuals. But in 1983, the price of copper dropped. Also, the copper ore they were mining was not as good quality. Because of this, Kennecott closed the smelter and tore it down. When the main employer left, many people moved away. This caused McGill's population to become much smaller.
Geography
McGill is located in Nevada. According to the United States Census Bureau, the area of McGill is about 1.1 square miles (3.13 square kilometers). All of this area is land.
Population Information
| Historical population | |||
|---|---|---|---|
| Census | Pop. | %± | |
| 2020 | 1,010 | — | |
| U.S. Decennial Census | |||
In 2000, there were 1,054 people living in McGill. There were 448 households, which are groups of people living in one home. About 26.6% of these households had children under 18. The average age of people in McGill was 43 years old.
Climate
The climate describes the usual weather conditions in a place over a long time. McGill has a climate with warm summers and cold winters. You can see more details about the temperatures and rainfall in the table below.
| Climate data for McGill, Nevada (1991–2020 normals, extremes 1892–present) | |||||||||||||
|---|---|---|---|---|---|---|---|---|---|---|---|---|---|
| Month | Jan | Feb | Mar | Apr | May | Jun | Jul | Aug | Sep | Oct | Nov | Dec | Year |
| Record high °F (°C) | 66 (19) |
70 (21) |
80 (27) |
89 (32) |
96 (36) |
100 (38) |
104 (40) |
100 (38) |
97 (36) |
92 (33) |
78 (26) |
68 (20) |
104 (40) |
| Mean maximum °F (°C) | 54.6 (12.6) |
57.8 (14.3) |
67.3 (19.6) |
75.0 (23.9) |
83.2 (28.4) |
90.7 (32.6) |
95.6 (35.3) |
92.9 (33.8) |
87.6 (30.9) |
78.9 (26.1) |
67.2 (19.6) |
56.9 (13.8) |
96.1 (35.6) |
| Mean daily maximum °F (°C) | 41.2 (5.1) |
44.2 (6.8) |
52.8 (11.6) |
59.1 (15.1) |
68.5 (20.3) |
80.3 (26.8) |
88.3 (31.3) |
86.9 (30.5) |
77.8 (25.4) |
65.0 (18.3) |
51.1 (10.6) |
41.3 (5.2) |
63.0 (17.2) |
| Daily mean °F (°C) | 28.0 (−2.2) |
30.9 (−0.6) |
38.6 (3.7) |
44.6 (7.0) |
53.0 (11.7) |
63.0 (17.2) |
71.0 (21.7) |
69.8 (21.0) |
60.2 (15.7) |
48.1 (8.9) |
36.7 (2.6) |
27.7 (−2.4) |
47.6 (8.7) |
| Mean daily minimum °F (°C) | 14.9 (−9.5) |
17.6 (−8.0) |
24.4 (−4.2) |
30.2 (−1.0) |
37.5 (3.1) |
45.8 (7.7) |
53.6 (12.0) |
52.7 (11.5) |
42.7 (5.9) |
31.2 (−0.4) |
22.2 (−5.4) |
14.1 (−9.9) |
32.2 (0.1) |
| Mean minimum °F (°C) | −4.5 (−20.3) |
−1.2 (−18.4) |
9.4 (−12.6) |
18.1 (−7.7) |
25.1 (−3.8) |
34.4 (1.3) |
43.9 (6.6) |
42.9 (6.1) |
30.3 (−0.9) |
18.5 (−7.5) |
5.9 (−14.5) |
−3.6 (−19.8) |
−8.1 (−22.3) |
| Record low °F (°C) | −25 (−32) |
−22 (−30) |
−18 (−28) |
6 (−14) |
15 (−9) |
20 (−7) |
24 (−4) |
27 (−3) |
20 (−7) |
4 (−16) |
−17 (−27) |
−24 (−31) |
−25 (−32) |
| Average precipitation inches (mm) | 0.65 (17) |
0.74 (19) |
0.90 (23) |
1.06 (27) |
1.04 (26) |
0.60 (15) |
0.49 (12) |
0.54 (14) |
0.75 (19) |
0.75 (19) |
0.66 (17) |
0.67 (17) |
8.85 (225) |
| Average snowfall inches (cm) | 6.3 (16) |
7.7 (20) |
5.9 (15) |
3.6 (9.1) |
1.2 (3.0) |
0.0 (0.0) |
0.0 (0.0) |
0.0 (0.0) |
0.0 (0.0) |
0.6 (1.5) |
3.4 (8.6) |
8.2 (21) |
36.9 (94) |
| Average precipitation days (≥ 0.01 in) | 5.3 | 5.6 | 5.3 | 5.7 | 5.9 | 3.1 | 3.2 | 3.8 | 3.6 | 4.1 | 3.9 | 4.6 | 54.1 |
| Average snowy days (≥ 0.1 in) | 2.1 | 3.1 | 2.8 | 1.4 | 0.3 | 0.0 | 0.0 | 0.0 | 0.1 | 0.3 | 1.4 | 2.6 | 14.1 |
| Source: NOAA | |||||||||||||
See also
 In Spanish: McGill (Nevada) para niños
 | Aaron Henry |
 | T. R. M. Howard |
 | Jesse Jackson |

