Mildred, Montana facts for kids
Quick facts for kids
Mildred, Montana
|
|
|---|---|
| Country | United States |
| State | Montana |
| County | Prairie |
| Elevation | 2,359 ft (719 m) |
| Time zone | UTC-7 (Mountain (MST)) |
| • Summer (DST) | UTC-6 (MDT) |
| ZIP code |
59341
|
| Area code(s) | 406 |
| GNIS feature ID | 774199 |
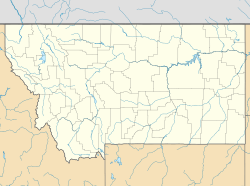
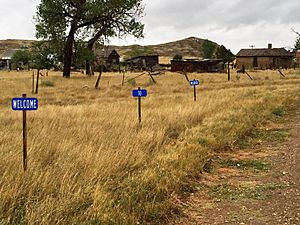
Mildred is a small place in Prairie County, Montana, in the United States. It's called an unincorporated community. This means it's not an official city or town with its own local government.
Mildred was officially mapped out in 1908. It is located about 18.5 miles (about 30 kilometers) east-southeast of Terry. The community grew up along a former railroad line, which was once very important for travel and trade.
Mildred's Weather and Climate
Mildred experiences a type of weather known as a cold semi-arid climate. This means it's generally dry, but it can get very cold in winter. Summers are usually hot.
Extreme Temperatures in Mildred
Mildred has seen some very hot and very cold days! The highest temperature ever recorded was 110 degrees Fahrenheit (43 degrees Celsius). This happened on July 15, 2002. The coldest temperature recorded was a chilly -46 degrees Fahrenheit (-43 degrees Celsius) on December 22, 1989.
| Climate data for Mildred, Montana, 1991–2020 normals, extremes 1979–present | |||||||||||||
|---|---|---|---|---|---|---|---|---|---|---|---|---|---|
| Month | Jan | Feb | Mar | Apr | May | Jun | Jul | Aug | Sep | Oct | Nov | Dec | Year |
| Record high °F (°C) | 64 (18) |
73 (23) |
83 (28) |
92 (33) |
102 (39) |
109 (43) |
110 (43) |
108 (42) |
105 (41) |
94 (34) |
78 (26) |
66 (19) |
110 (43) |
| Mean maximum °F (°C) | 50.9 (10.5) |
55.0 (12.8) |
70.2 (21.2) |
80.7 (27.1) |
87.0 (30.6) |
94.4 (34.7) |
101.1 (38.4) |
100.4 (38.0) |
95.9 (35.5) |
83.5 (28.6) |
66.8 (19.3) |
52.6 (11.4) |
102.9 (39.4) |
| Mean daily maximum °F (°C) | 28.6 (−1.9) |
33.2 (0.7) |
45.5 (7.5) |
57.3 (14.1) |
67.3 (19.6) |
77.5 (25.3) |
87.2 (30.7) |
86.6 (30.3) |
75.6 (24.2) |
59.1 (15.1) |
43.8 (6.6) |
32.2 (0.1) |
57.8 (14.4) |
| Daily mean °F (°C) | 17.1 (−8.3) |
21.2 (−6.0) |
32.3 (0.2) |
43.3 (6.3) |
53.3 (11.8) |
63.6 (17.6) |
71.4 (21.9) |
69.9 (21.1) |
59.3 (15.2) |
45.1 (7.3) |
31.6 (−0.2) |
20.9 (−6.2) |
44.1 (6.7) |
| Mean daily minimum °F (°C) | 5.6 (−14.7) |
9.3 (−12.6) |
19.1 (−7.2) |
29.3 (−1.5) |
39.4 (4.1) |
49.7 (9.8) |
55.6 (13.1) |
53.2 (11.8) |
43.0 (6.1) |
31.2 (−0.4) |
19.4 (−7.0) |
9.7 (−12.4) |
30.4 (−0.9) |
| Mean minimum °F (°C) | −22.4 (−30.2) |
−13.8 (−25.4) |
−5.3 (−20.7) |
12.7 (−10.7) |
25.6 (−3.6) |
37.1 (2.8) |
44.1 (6.7) |
39.3 (4.1) |
28.9 (−1.7) |
14.3 (−9.8) |
−3.6 (−19.8) |
−16.8 (−27.1) |
−27.7 (−33.2) |
| Record low °F (°C) | −43 (−42) |
−38 (−39) |
−32 (−36) |
−8 (−22) |
15 (−9) |
28 (−2) |
34 (1) |
27 (−3) |
13 (−11) |
−10 (−23) |
−28 (−33) |
−46 (−43) |
−46 (−43) |
| Average precipitation inches (mm) | 0.29 (7.4) |
0.33 (8.4) |
0.57 (14) |
1.54 (39) |
2.83 (72) |
2.30 (58) |
2.03 (52) |
1.26 (32) |
1.35 (34) |
1.15 (29) |
0.37 (9.4) |
0.30 (7.6) |
14.32 (362.8) |
| Average precipitation days (≥ 0.01 in) | 3.8 | 3.4 | 4.4 | 5.9 | 8.8 | 7.7 | 6.7 | 4.5 | 4.6 | 4.6 | 3.0 | 3.3 | 60.7 |
| Source 1: NOAA | |||||||||||||
| Source 2: National Weather Service | |||||||||||||
 | Selma Burke |
 | Pauline Powell Burns |
 | Frederick J. Brown |
 | Robert Blackburn |


