Monmouth, Iowa facts for kids
Quick facts for kids
Monmouth, Iowa
|
|
|---|---|
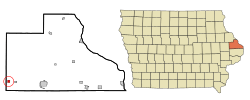
Location of Monmouth, Iowa
|
|
| Country | |
| State | |
| County | Jackson |
| Incorporated | July 12, 1894 |
| Area | |
| • Total | 0.57 sq mi (1.47 km2) |
| • Land | 0.57 sq mi (1.47 km2) |
| • Water | 0.00 sq mi (0.00 km2) |
| Elevation | 755 ft (230 m) |
| Population
(2020)
|
|
| • Total | 129 |
| • Density | 226.71/sq mi (87.57/km2) |
| Time zone | UTC-6 (Central (CST)) |
| • Summer (DST) | UTC-5 (CDT) |
| ZIP code |
52309
|
| Area code(s) | 563 |
| FIPS code | 19-53265 |
| GNIS feature ID | 0459172 |
Monmouth is a small city located in Jackson County, Iowa, in the United States. In 2020, about 129 people lived there. It's a quiet place with a friendly community.
Contents
History of Monmouth
Monmouth was first planned and settled in 1856. It got its name from Monmouth Township, which is the area it's located in.
Geography and Location
Monmouth is found at specific coordinates: 42 degrees, 4 minutes, 35 seconds North and 90 degrees, 52 minutes, 50 seconds West. This helps pinpoint its exact spot on a map.
The city covers a total area of about 0.56 square miles (1.47 square kilometers). All of this area is land, meaning there are no large lakes or rivers within the city limits.
Population and People
| Historical populations | ||
|---|---|---|
| Year | Pop. | ±% |
| 1900 | 281 | — |
| 1910 | 221 | −21.4% |
| 1920 | 200 | −9.5% |
| 1930 | 198 | −1.0% |
| 1940 | 190 | −4.0% |
| 1950 | 198 | +4.2% |
| 1960 | 291 | +47.0% |
| 1970 | 257 | −11.7% |
| 1980 | 210 | −18.3% |
| 1990 | 169 | −19.5% |
| 2000 | 180 | +6.5% |
| 2010 | 153 | −15.0% |
| 2020 | 129 | −15.7% |
| Source: and Iowa Data Center Source: |
||
Monmouth's Population in 2020
According to the census taken in 2020, 129 people lived in Monmouth. There were 61 households, which are like homes or families living together.
Most of the people living in Monmouth were White (about 95.3%). A small number of people were from other racial backgrounds (less than 5%). About 1.6% of the population identified as Hispanic or Latino.
The average age of people in Monmouth was about 53.1 years old. This means many adults live there. About 19.4% of residents were under 20 years old. Also, 21.7% were 65 years or older.
Monmouth's Population in 2010
In the census of 2010, Monmouth had 153 people. There were 63 households in the city.
Most people were White (98.0%). A very small percentage were African American or Asian. About 2.0% of the population was Hispanic or Latino.
The average age in 2010 was 45.2 years. About 17% of the residents were under 18 years old. Also, 15.7% were 65 years or older.
Education in Monmouth
Students in Monmouth attend schools within the Midland Community School District. This district provides education for the children living in the area.
See also
 In Spanish: Monmouth (Iowa) para niños
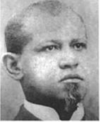 | Calvin Brent |
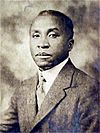 | Walter T. Bailey |
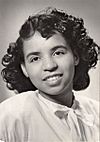 | Martha Cassell Thompson |
 | Alberta Jeannette Cassell |

