New Castle, Virginia facts for kids
Quick facts for kids
New Castle, Virginia
|
|
|---|---|

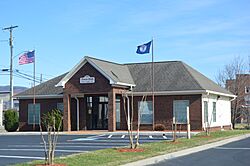
Town hall
|
|

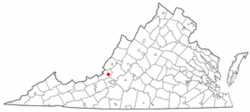
Location of New Castle, Virginia
|
|
| Country | United States |
| State | Virginia |
| County | Craig |
| Area | |
| • Total | 0.17 sq mi (0.4 km2) |
| • Land | 0.17 sq mi (0.4 km2) |
| • Water | 0.00 sq mi (0 km2) |
| Elevation | 1,352 ft (412 m) |
| Population | |
| • Total | 125 |
| • Density | 927.27/sq mi (358.02/km2) |
| Time zone | UTC-5 (Eastern (EST)) |
| • Summer (DST) | UTC-4 (EDT) |
| ZIP code |
24127
|
| Area code(s) | 540 |
| FIPS code | 51-55592 |
| GNIS feature ID | 1498522 |
New Castle is a small town located in Craig County, Virginia, United States. It is the only town in Craig County. New Castle is also the county seat, which means it's where the main government offices for Craig County are located.
In 2020, about 125 people lived in New Castle. The town is a part of the larger Roanoke area. Important roads like State Route 311 and State Route 42 meet here.
Contents
Exploring New Castle's Location
New Castle is found at these coordinates: 37°30′3″N 80°6′39″W / 37.50083°N 80.11083°W. It covers a very small area, only about 0.2 square miles (0.4 square kilometers), and all of it is land.
Natural Features Around New Castle
The town has some interesting natural spots nearby. To the west, there are high cliffs. These cliffs help guide the New River's water away from New Castle.
Another cool place is Johns Creek gorge. This gorge has exciting whitewater rapids. It's part of the James River watershed. For a while, people couldn't paddle Johns Creek because of a land dispute. But now, court decisions have made it open again for paddlers.
New Castle is also close to special areas within the Jefferson National Forest. These areas are known for their beautiful "Mountain Treasures." They include the Sinking Creek Valley Cluster, Craig Creek Cluster, and Barbours Creek-Shawvers Run Cluster.
New Castle's Weather and Climate
| Climate data for New Castle, VA (1991-2020 precipitation normals) | |||||||||||||
|---|---|---|---|---|---|---|---|---|---|---|---|---|---|
| Month | Jan | Feb | Mar | Apr | May | Jun | Jul | Aug | Sep | Oct | Nov | Dec | Year |
| Average precipitation inches | 3.21 | 2.82 | 3.56 | 3.89 | 4.66 | 4.37 | 4.32 | 3.54 | 3.74 | 3.45 | 2.78 | 3.48 | 43.82 |
| Average precipitation mm | 82 | 72 | 90 | 99 | 118 | 111 | 110 | 90 | 95 | 88 | 71 | 88 | 1,114 |
| Source: NOAA | |||||||||||||
New Castle experiences a climate with different seasons. The weatherbox above shows the average rainfall for each month. This information helps us understand the typical weather patterns in the area.
Population and People of New Castle
| Historical population | |||
|---|---|---|---|
| Census | Pop. | %± | |
| 1860 | 225 | — | |
| 1870 | 199 | −11.6% | |
| 1880 | 182 | −8.5% | |
| 1890 | 214 | 17.6% | |
| 1900 | 299 | 39.7% | |
| 1920 | 702 | — | |
| 1930 | 259 | −63.1% | |
| 1940 | 253 | −2.3% | |
| 1950 | 239 | −5.5% | |
| 1960 | 200 | −16.3% | |
| 1970 | 225 | 12.5% | |
| 1980 | 213 | −5.3% | |
| 1990 | 152 | −28.6% | |
| 2000 | 179 | 17.8% | |
| 2010 | 153 | −14.5% | |
| 2020 | 125 | −18.3% | |
The population of New Castle has changed over many years. The chart above shows how many people have lived in the town during different census years.
Understanding the Community (2000 Census)
In the year 2000, there were 179 people living in New Castle. These people lived in 85 different homes, and 51 of these were families. The town had about 1,105 people per square mile. All the residents counted in 2000 were White.
About 23.5% of the homes had children under 18 living there. Nearly half (47.1%) were married couples. Some homes (10.6%) had a female head of household without a husband. About 36.5% of all homes were individuals living alone.
The average home had about 2.11 people. For families, the average size was 2.73 people.
Age Groups and Income
In 2000, the population was spread out by age. About 22.9% were under 18 years old. Around 12.3% were between 18 and 24. People aged 25 to 44 made up 23.5% of the population. Those 45 to 64 years old were 25.1%. Finally, 16.2% of the population was 65 years or older. The average age in the town was 37 years.
The average income for a household in New Castle was $26,250. For families, the average income was $35,750. The average income per person in the town was $14,119. About 20.4% of families and 17.2% of all residents lived below the poverty line. This included 28.2% of those under 18 and 6.1% of those 65 or older.
See also
 In Spanish: New Castle (Virginia) para niños
 | James Van Der Zee |
 | Alma Thomas |
 | Ellis Wilson |
 | Margaret Taylor-Burroughs |


