
New York's 11th congressional district facts for kids
Quick facts for kids New York's 11th congressional district |
|||
|---|---|---|---|
New York 's 11th congressional district since January 3, 2013
|
|||
| Representative |
|
||
| Distribution |
|
||
| Population (2019) | 737,390 | ||
| Median income | $81,253 | ||
| Ethnicity | |||
| Cook PVI | R+3 | ||
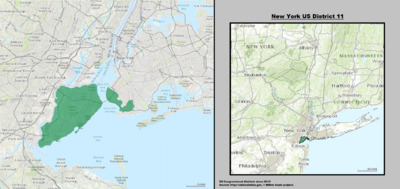
New York's 11th congressional district is a special area in New York City. People living here get to choose someone to represent them. This person works in the United States House of Representatives in Washington, D.C. The 11th district covers all of Staten Island and parts of Brooklyn.
Currently, the district's representative is Nicole Malliotakis. She is a member of the Republican Party. She was chosen by voters in 2020. Before her, the district was represented by Max Rose, a Democrat. The 2020 election was one of the few times a district changed from Democratic to Republican.
Contents
What is a Congressional District?
A congressional district is a specific area within a state. Each district has about 700,000 to 800,000 people. These people vote for one person to represent them. This representative then goes to the United States House of Representatives. There are 435 such districts across the United States. New York State has many districts, and the 11th is one of them.
Who Represents the District?
The person who represents the 11th district is called a Representative or Congressperson. Their job is to speak for the people in their district. They vote on new laws and help solve problems for their community. They work in the U.S. Capitol building in Washington, D.C.
Current Representative: Nicole Malliotakis
Nicole Malliotakis is the current Representative for the 11th district. She is a Republican. She was born in Staten Island. Before becoming a Congressperson, she served in the New York State Assembly. She won her election in November 2020.
How Elections Work
People in the 11th district vote for their Representative every two years. This is how they choose who will speak for them in Congress. The person with the most votes wins the election.
Presidential Election Results
The way people vote in presidential elections can sometimes show how a district leans. Here's how the 11th district voted in recent presidential races:
| Election results from presidential races | ||
|---|---|---|
| Year | Office | Results |
| 2012 | President | Obama 52 - 47% |
| 2016 | President | Trump 54 - 44% |
| 2020 | President | Trump 55 - 44% |
Recent Congressional Elections
Here are the results from the most recent elections for the district's Representative:
2018 Election
In 2018, Max Rose won the election. He was a Democrat. He beat the Republican who was in office at the time, Daniel M. Donovan.
| 2018 election | ||||||
|---|---|---|---|---|---|---|
| Party | Candidate | Votes | % | ±% | ||
| Democratic | Max Rose | 101,823 | 53.0 | |||
| Republican | Daniel M. Donovan (Incumbent) | 89,441 | 46.6 | |||
| Democratic gain from Republican | ||||||
2020 Election
In 2020, Nicole Malliotakis won the election. She is a Republican. She beat the Democrat who was in office, Max Rose. This election changed which party represented the district.
| 2020 election | |||||
|---|---|---|---|---|---|
| Party | Candidate | Votes | % | ±% | |
| Republican | Nicole Malliotakis | 155,608 | 53.2 | +6.4 | |
| Democratic | Max Rose (Incumbent) | 137,198 | 46.8 | -6.2 | |
| Republican gain from Democratic | Swing | +12.6 | |||
See also
 In Spanish: 11.º distrito congresional de Nueva York para niños
