Oak Grove, Kaufman County, Texas facts for kids
Quick facts for kids
Oak Grove, Texas
|
|
|---|---|

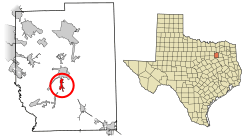
Location of Oak Grove in Kaufman County, Texas
|
|
| Country | United States |
| State | Texas |
| County | Kaufman |
| Area | |
| • Total | 1.96 sq mi (5.08 km2) |
| • Land | 1.96 sq mi (5.08 km2) |
| • Water | 0.00 sq mi (0.00 km2) |
| Elevation | 420 ft (130 m) |
| Population
(2020)
|
|
| • Total | 617 |
| • Density | 314.8/sq mi (121.46/km2) |
| Time zone | UTC-6 (Central (CST)) |
| • Summer (DST) | UTC-5 (CDT) |
| Area code(s) | 214, 469, 945, 972 |
| FIPS code | 48-52902 |
| GNIS feature ID | 2413062 |
Oak Grove is a small town located in Kaufman County, Texas, in the United States. It is a quiet community where people live and work. In 2020, the town had a population of 617 people.
Contents
Geography of Oak Grove
Oak Grove is found in the middle part of Kaufman County. It is about 4 miles (6.4 km) south of Kaufman. Kaufman is the main city in the county, also known as the county seat.
The United States Census Bureau says that Oak Grove covers a total area of about 1.96 square miles (5.08 square kilometers). All of this area is land, meaning there are no large lakes or rivers within the town's borders.
Understanding Oak Grove's Population
This section helps us learn about the people who live in Oak Grove. It looks at how many people live there and what groups they belong to. This information comes from official counts called the census.
Population Changes Over Time
The number of people living in Oak Grove has changed over the years. Here is a quick look at the population counts from different censuses:
| Historical population | |||
|---|---|---|---|
| Census | Pop. | %± | |
| 1980 | 319 | — | |
| 1990 | 557 | 74.6% | |
| 2000 | 710 | 27.5% | |
| 2010 | 603 | −15.1% | |
| 2020 | 617 | 2.3% | |
| U.S. Decennial Census 2020 Census |
|||
In 2000, there were 710 people living in Oak Grove. These people lived in 258 different homes. Most of these homes (224) were families.
Who Lives in Oak Grove?
In 2000, most people in Oak Grove were White (96.20%). A small number of residents were African American (0.85%) or Asian (1.41%). Some people were from other backgrounds (0.70%) or a mix of two or more backgrounds (0.85%). About 3.38% of the population identified as Hispanic or Latino.
Most homes (80.6%) were married couples living together. About 36.8% of homes had children under 18 living there. The average number of people in a home was 2.75. For families, the average size was 2.98 people.
Age Groups in the Community
The population of Oak Grove includes people of all ages. In 2000:
- 25.8% of residents were under 18 years old.
- 4.6% were between 18 and 24 years old.
- 23.5% were between 25 and 44 years old.
- 31.1% were between 45 and 64 years old.
- 14.9% were 65 years old or older.
The average age of people in Oak Grove was 43 years. For every 100 females, there were about 92.4 males.
Household Income in Oak Grove
In 2000, the average income for a household in Oak Grove was $65,938 per year. For families, the average income was $71,250 per year. The average income for each person in the town was $28,551. A small number of families and people lived on lower incomes.
Education in Oak Grove
Students in Oak Grove attend schools that are part of the Kaufman Independent School District. This school district serves the town's young people.
All the schools for Oak Grove students are located in the nearby city of Kaufman. These schools include:
- Phillips Elementary School
- Nash Intermediate School
- Norman Junior High School
- Kaufman High School
See also
 In Spanish: Oak Grove (Texas) para niños
 | Frances Mary Albrier |
 | Whitney Young |
 | Muhammad Ali |

