Oakwood, Paulding County, Ohio facts for kids
Quick facts for kids
Oakwood, Ohio
|
|
|---|---|
|
Village
|
|
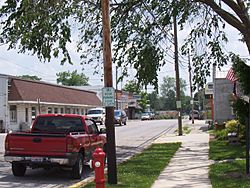
Downtown Oakwood
|
|
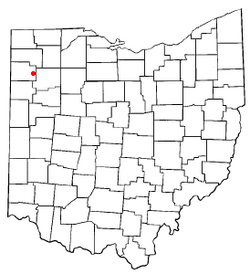
Location of Oakwood, Paulding County, Ohio
|
|
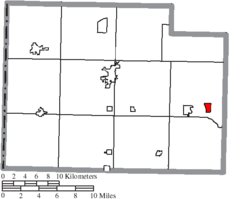
Location of Oakwood in Paulding County
|
|
| Country | United States |
| State | Ohio |
| County | Paulding |
| Township | Brown |
| Area | |
| • Total | 0.70 sq mi (1.82 km2) |
| • Land | 0.70 sq mi (1.82 km2) |
| • Water | 0.00 sq mi (0.00 km2) |
| Elevation | 715 ft (218 m) |
| Population
(2020)
|
|
| • Total | 546 |
| • Density | 777.78/sq mi (300.17/km2) |
| Time zone | UTC-5 (Eastern (EST)) |
| • Summer (DST) | UTC-4 (EDT) |
| ZIP code |
45873
|
| Area code(s) | 419 |
| FIPS code | 39-57792 |
| GNIS feature ID | 2399546 |
Oakwood is a small village located in Paulding County, Ohio, in the United States. In 2020, about 546 people lived there. It's a quiet community in the northwestern part of the state.
Contents
About Oakwood's Location
Oakwood is a small village, covering an area of about 0.70 square miles (1.82 square kilometers). All of this area is land, meaning there are no large lakes or rivers within the village limits.
Who Lives in Oakwood?
The population of Oakwood has changed over the years. Here's how many people have lived there during different census counts:
| Historical population | |||
|---|---|---|---|
| Census | Pop. | %± | |
| 1880 | 23 | — | |
| 1890 | 378 | 1,543.5% | |
| 1900 | 342 | −9.5% | |
| 1910 | 496 | 45.0% | |
| 1920 | 443 | −10.7% | |
| 1930 | 452 | 2.0% | |
| 1940 | 466 | 3.1% | |
| 1950 | 542 | 16.3% | |
| 1960 | 686 | 26.6% | |
| 1970 | 804 | 17.2% | |
| 1980 | 886 | 10.2% | |
| 1990 | 709 | −20.0% | |
| 2000 | 607 | −14.4% | |
| 2010 | 608 | 0.2% | |
| 2020 | 546 | −10.2% | |
| U.S. Decennial Census | |||
Oakwood's Population in 2010
In 2010, the village of Oakwood had 608 residents. These people lived in 228 different homes, with 159 of those being families. The village was quite spread out, with about 1030 people per square mile.
Most of the people living in Oakwood in 2010 were White (96.9%). A small number were Native American (0.2%), or from other backgrounds. About 4.3% of the population identified as Hispanic or Latino.
Households and Families
Out of the 228 homes in Oakwood, about 37% had children under 18 living there. Nearly half (48.2%) were married couples living together. Some homes had a single parent, either a mother (12.7%) or a father (8.8%). About 30% of homes were individuals or groups of friends living together, not families.
About a quarter of all homes (25%) were made up of just one person. Around 9.7% of homes had someone living alone who was 65 years old or older. On average, there were about 2.67 people in each home and 3.16 people in each family.
Age of Residents
The average age of people in Oakwood in 2010 was 33.4 years old.
- About 28% of residents were under 18 years old.
- Around 8.8% were young adults between 18 and 24.
- The largest group, 28.3%, were adults aged 25 to 44.
- About 20% were between 45 and 64 years old.
- Finally, 14.5% of the population was 65 years old or older.
The village had a nearly even split between males (50.3%) and females (49.7%).
Education in Oakwood
Oakwood has a public library that is part of the Paulding County Library system. This means residents have access to books and other resources for learning and fun.
See also
 In Spanish: Oakwood (condado de Paulding, Ohio) para niños
 | Roy Wilkins |
 | John Lewis |
 | Linda Carol Brown |

