Pellejas, Orocovis, Puerto Rico facts for kids
Quick facts for kids
Pellejas
|
|
|---|---|
|
Barrio
|
|

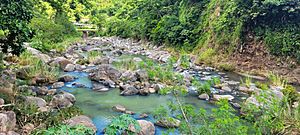
Bauta River between Pellejas and Damián Abajo barrios
|
|

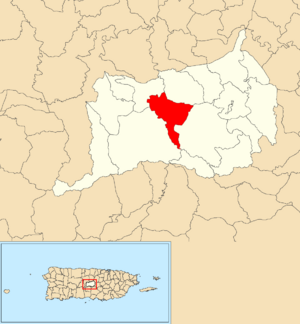
Location of Pellejas within the municipality of Orocovis shown in red
|
|
| Lua error in Module:Location_map at line 416: Malformed coordinates value. | |
| Commonwealth | |
| Municipality | |
| Area | |
| • Total | 3.53 sq mi (9.1 km2) |
| • Land | 3.53 sq mi (9.1 km2) |
| • Water | 0 sq mi (0 km2) |
| Elevation | 2,579 ft (786 m) |
| Population
(2010)
|
|
| • Total | 577 |
| • Density | 163.5/sq mi (63.1/km2) |
| Source: 2010 Census | |
| Time zone | UTC−4 (AST) |
Pellejas is a small area in the town of Orocovis, Puerto Rico. It's known as a barrio, which is like a neighborhood or district. In 2010, about 577 people lived there.
What is a Barrio?
In Puerto Rico, a barrio is a local area within a larger municipality or town. Think of it like a specific part of a city or a small village. These barrios are further divided into even smaller areas called sectores, which means sectors in English.
For example, a sector could be a residential area, a housing development, or just a specific part of the barrio. However, Pellejas barrio does not have any smaller sectors within it. It's just one area.
A Look at Pellejas History
Pellejas, like the rest of Puerto Rico, has an interesting history. After the Spanish–American War in 1898, Spain gave Puerto Rico to the United States. This happened under the Treaty of Paris of 1898. Puerto Rico then became a territory of the United States.
In 1899, the U.S. government took a count of all the people living in Puerto Rico. They found that Pellejas barrio, combined with a nearby area called Bauta Arriba, had a total of 1,331 people.
Population Changes Over Time
The number of people living in Pellejas has changed over the years. Here's a quick look at the population from different U.S. Census counts:
- 1980: 651 people
- 1990: 692 people
- 2000: 436 people
- 2010: 577 people
| Historical population | |||
|---|---|---|---|
| Census | Pop. | %± | |
| 1980 | 651 | — | |
| 1990 | 692 | 6.3% | |
| 2000 | 436 | −37.0% | |
| 2010 | 577 | 32.3% | |
| U.S. Decennial Census 1899 (shown as 1900) 1910-1930 1930-1950 1980-2000 2010 |
|||
More to Explore
- List of communities in Puerto Rico
- In Spanish: Pellejas (Orocovis) para niños

 | Emma Amos |
 | Edward Mitchell Bannister |
 | Larry D. Alexander |
 | Ernie Barnes |

