Puerto Lempira facts for kids
Quick facts for kids
Puerto Lempira
|
|
|---|---|
|
Municipality
|
|

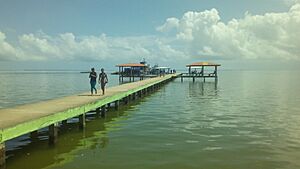
Dock in Puerto Lempira
|
|
| Country | Honduras |
| Department | Gracias a Dios |
| Villages | 31 |
| Area | |
| • Municipality | 7,126 km2 (2,751 sq mi) |
| Elevation | 10 m (30 ft) |
| Population
(2023 projection)
|
|
| • Municipality | 61,626 |
| • Density | 8.6480/km2 (22.3983/sq mi) |
| • Urban | 25,662 |
| Time zone | UTC−6 (Central America) |
| Climate | Af |
Puerto Lempira, also known as Auhya Yari, is an important town in northeastern Honduras. It is the main town for the Miskito people in the Gracias a Dios department. You can find it right on the shores of the beautiful Caratasca Lagoon. Even though it doesn't have paved roads, it is the largest town in the La Mosquitia region.
The town got its name from Lempira, a brave leader from the 1500s. He was a leader of the Lenca people, who are native to the area. Lempira led a fight against the Spanish conquistador forces, but sadly, they were not successful.
Puerto Lempira became the capital of its department in 1975. Before that, the capital was a place called Brus Laguna. In the 1980s, the town became a busy spot for some important international activities. As of 2023, about 22,860 people live here. Since 2011, Puerto Lempira has been a sister city to Plattsburgh, New York in the United States.
Contents
People and Culture
Who Lives Here?
In 2013, a census counted 47,528 people living in the Puerto Lempira area. Most of these people, about 82.41%, are Indigenous. A large part of them, 81.98%, are from the Miskito group. The rest of the population includes Mestizo people (about 14.86%), Afro-Honduran or Black people (about 1.34%), and White people (about 1.27%). A small number of others make up the rest.
What Languages Are Spoken?
The Miskito language is the most common language spoken here and is even official in the region. After Miskito, people also speak Mayangna and Spanish.
Getting Around
The city has its own airport, called Puerto Lempira Airport. This airport has several flights each week on a regular schedule, making it easier for people to travel to and from the area.
Weather
What's the Weather Like?
Puerto Lempira is on the Caribbean side of Central America. This means it has a warm, humid, and rainy tropical rainforest climate. This type of climate is known as Af in the Köppen climate classification system.
Even in March, which is its driest month, there is still some rain. This is because of the wet trade winds that blow through the area. From June to December, the town gets a lot of rain, often more than 300 millimeters (about 12 inches) each month!
See also
 In Spanish: Puerto Lempira para niños


