Rock Spring, Georgia facts for kids
Quick facts for kids
Rock Spring
|
|
|---|---|
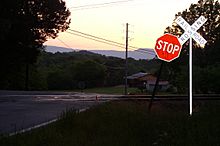
Lookout Mountain from Rock Spring.
|
|
| Country | USA |
| State | Georgia |
| County | Walker County |
| Elevation | 263 m (863 ft) |
| Population | |
| • Total | 891 |
| Time zone | UTC-5 (Eastern (EST)) |
| • Summer (DST) | UTC-4 (EDT) |
| GNIS feature ID | 2812702 |
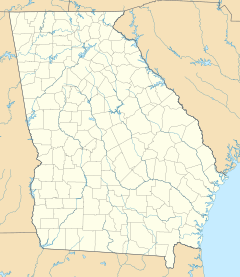
Rock Spring is a small community in northwest Georgia, United States. It is located in Walker County. Rock Spring is about 14 miles (23 km) south of Chattanooga, Tennessee.
In 2020, the community had a population of 891 people.
About Rock Spring
Rock Spring is close to some bigger cities. The nearest large city is Chattanooga. The closest towns are Chickamauga and La Fayette.
The community has several schools for local kids. These include Rock Spring Elementary School, Saddle Ridge Elementary, and Saddle Ridge Middle School. They are all part of the Walker County School District.
A Look at History
The area around Rock Spring in northwest Georgia has an important history. It played a big part in the Civil War.
One of the major battles of the war, the Battle of Chickamauga, happened nearby. Today, you can visit the Chickamauga and Chattanooga National Military Park. This park covers over 9,000 acres and is located in nearby Chickamauga. It helps people remember the history of the Civil War.
Population Facts
| Historical population | |||
|---|---|---|---|
| Census | Pop. | %± | |
| 2020 | 891 | — | |
| U.S. Decennial Census 1850-1870 1870-1880 1890-1910 1920-1930 1940 1950 1960 1970 1980 1990 2000 2020 |
|||
Rock Spring was officially counted as a "census-designated place" for the first time in the 2020 U.S. Census. This means it was recognized as a specific area for counting people.
Most of the people living in Rock Spring in 2020 were White. There were also smaller groups of Black or African American people, Asian people, and people of mixed races.
 | Bayard Rustin |
 | Jeannette Carter |
 | Jeremiah A. Brown |


