Rothbury, Michigan facts for kids
Quick facts for kids
Rothbury, Michigan
|
|
|---|---|
|
Village
|
|
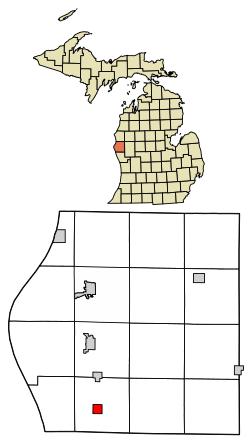
Location of Rothbury, Michigan
|
|
| Country | United States |
| State | Michigan |
| County | Oceana |
| Area | |
| • Total | 5.12 sq mi (6.65 km2) |
| • Land | 4.20 sq mi (6.37 km2) |
| • Water | 0.92 sq mi (0.28 km2) |
| Elevation | 702 ft (214 m) |
| Population
(2020)
|
|
| • Total | 486 |
| • Density | 187.88/sq mi (72.53/km2) |
| Time zone | UTC-5 (Eastern (EST)) |
| • Summer (DST) | UTC-4 (EDT) |
| ZIP code |
49452
|
| Area code(s) | 231 |
| FIPS code | 26-69880 |
| GNIS feature ID | 1621442 |
Rothbury is a small village located in Oceana County, Michigan, in the United States. It is part of Grant Township. In 2010, the village had a population of 432 people.
Contents
Rothbury's Location and Size
Rothbury covers a total area of about 5.12 square miles (13.26 square kilometers). Most of this area is land, about 4.20 square miles (10.88 square kilometers). A smaller part, about 0.92 square miles (2.38 square kilometers), is water.
Population and People
How Many People Live in Rothbury?
The population of Rothbury has changed over the years. Here's a look at the numbers from different census reports:
| Historical population | |||
|---|---|---|---|
| Census | Pop. | %± | |
| 1970 | 394 | — | |
| 1980 | 522 | 32.5% | |
| 1990 | 407 | −22.0% | |
| 2000 | 416 | 2.2% | |
| 2010 | 432 | 3.8% | |
| 2020 | 462 | 6.9% | |
| U.S. Decennial Census | |||
Who Lives in Rothbury?
In 2010, there were 432 people living in Rothbury. These people lived in 162 different homes. About 110 of these were family homes.
The village had about 480 people per square mile. There were 174 housing units in total.
Most of the people in Rothbury were White (86.1%). Other groups included African American (0.9%), Native American (3.5%), and people from other races (1.9%). About 7.6% of the population identified with two or more races. People of Hispanic or Latino background made up 14.8% of the population.
Families and Age Groups
In 36.4% of the homes, there were children under 18 years old. Almost half of the homes (48.1%) were married couples living together. Some homes had a female head without a husband (11.7%), or a male head without a wife (8.0%). About 32.1% of homes were not families.
About 27.2% of all homes had only one person living there. And 9.3% of homes had someone living alone who was 65 years old or older. On average, there were 2.63 people in each home and 3.11 people in each family.
The average age of people in the village was 34.5 years.
- 27.5% of residents were under 18 years old.
- 10.5% were between 18 and 24 years old.
- 23.6% were between 25 and 44 years old.
- 26.6% were between 45 and 64 years old.
- 11.8% were 65 years old or older.
The village had slightly more females (51.4%) than males (48.6%).
See also

- In Spanish: Rothbury (Míchigan) para niños
 | Misty Copeland |
 | Raven Wilkinson |
 | Debra Austin |
 | Aesha Ash |

