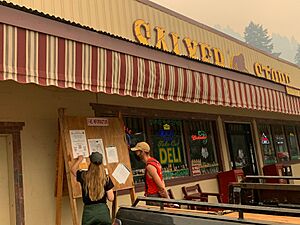
Salyer, California facts for kids
Quick facts for kids
Salyer, California
|
|
|---|---|

Salyer Store in Salyer, California.
|
|
| Country | United States |
| State | California |
| County | Trinity |
| Elevation | 620 ft (190 m) |
| Population
(2020)
|
|
| • Total | 389 |
| Time zone | UTC-8 (Pacific (PST)) |
| • Summer (DST) | UTC-7 (PDT) |
| ZIP code |
95563
|
| Area code(s) | 530 |
| GNIS feature ID | 232346 |
Salyer (called Miy-me’ by the Hupa people) is a small community in Trinity County, California. It is an unincorporated community. This means it is a place where people live, but it does not have its own local government like a city.
Salyer is located on State Highway 299. It is about 52 miles (84 km) east of Eureka. It is also about 93 miles (150 km) west of Redding. In 2020, 389 people lived in Salyer. The United States Census Bureau counts Salyer as a census-designated place (CDP). This helps them collect information about the population.
Discovering Salyer's Past
Salyer was officially started on April 16, 1918. It was named after Charles Marshall Salyer. He was a well-known miner in the area.
Before Salyer got its name, this land was home to the Tsnungwe Tribe. The community is right next to a Tsnungwe village called miy-me'. A Tsnungwe Indian named Dickson Dartt actually suggested naming the area after the village of miy-me'.
Salyer's Climate
Salyer has a type of weather called a hot-summer mediterranean climate. On climate maps, this is shown as "Csb." This means the area has warm and dry summers. The average monthly temperatures are not extremely hot.
| Climate data for Salyer, California | |||||||||||||
|---|---|---|---|---|---|---|---|---|---|---|---|---|---|
| Month | Jan | Feb | Mar | Apr | May | Jun | Jul | Aug | Sep | Oct | Nov | Dec | Year |
| Record high °F (°C) | 75 (24) |
78 (26) |
82 (28) |
91 (33) |
100 (38) |
106 (41) |
112 (44) |
110 (43) |
108 (42) |
98 (37) |
88 (31) |
75 (24) |
112 (44) |
| Mean maximum °F (°C) | 66 (19) |
68 (20) |
73 (23) |
79 (26) |
90 (32) |
99 (37) |
103 (39) |
102 (39) |
99 (37) |
90 (32) |
77 (25) |
64 (18) |
103 (39) |
| Mean daily maximum °F (°C) | 50.6 (10.3) |
56.7 (13.7) |
61.0 (16.1) |
68.0 (20.0) |
74.5 (23.6) |
84.2 (29.0) |
96.0 (35.6) |
95.4 (35.2) |
88.2 (31.2) |
73.7 (23.2) |
57.8 (14.3) |
49.3 (9.6) |
71.3 (21.8) |
| Daily mean °F (°C) | 42.6 (5.9) |
46.3 (7.9) |
49.5 (9.7) |
54.1 (12.3) |
59.4 (15.2) |
67.2 (19.6) |
74.8 (23.8) |
74.1 (23.4) |
68.3 (20.2) |
58.8 (14.9) |
47.1 (8.4) |
42.4 (5.8) |
57.0 (13.9) |
| Mean daily minimum °F (°C) | 34.4 (1.3) |
36.0 (2.2) |
38.1 (3.4) |
40.1 (4.5) |
44.4 (6.9) |
50.1 (10.1) |
53.6 (12.0) |
52.8 (11.6) |
48.5 (9.2) |
43.9 (6.6) |
38.5 (3.6) |
35.4 (1.9) |
43.0 (6.1) |
| Mean minimum °F (°C) | 25 (−4) |
27 (−3) |
29 (−2) |
33 (1) |
37 (3) |
42 (6) |
47 (8) |
45 (7) |
41 (5) |
34 (1) |
29 (−2) |
26 (−3) |
22 (−6) |
| Record low °F (°C) | 10 (−12) |
17 (−8) |
23 (−5) |
28 (−2) |
31 (−1) |
35 (2) |
40 (4) |
38 (3) |
32 (0) |
25 (−4) |
17 (−8) |
9 (−13) |
9 (−13) |
| Average precipitation inches (mm) | 8.78 (223) |
6.78 (172) |
4.93 (125) |
3.23 (82) |
1.80 (46) |
0.79 (20) |
0.16 (4.1) |
0.10 (2.5) |
0.60 (15) |
2.77 (70) |
5.79 (147) |
9.04 (230) |
44.77 (1,136.6) |
| Average snowfall inches (cm) | 2.2 (5.6) |
1.0 (2.5) |
0.3 (0.76) |
0.0 (0.0) |
0.0 (0.0) |
0.0 (0.0) |
0.0 (0.0) |
0.0 (0.0) |
0.0 (0.0) |
0.0 (0.0) |
0.1 (0.25) |
0.9 (2.3) |
4.5 (11.41) |
| Source: NOAA | |||||||||||||
 | Audre Lorde |
 | John Berry Meachum |
 | Ferdinand Lee Barnett |


