Seabrook, South Carolina facts for kids
Quick facts for kids
Seabrook
|
|
|---|---|

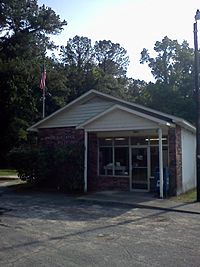
Current Post office in Seabrook, South Carolina
|
|
| Country | United States |
| State | South Carolina |
| County | Beaufort |
| Area | |
| • Total | 6.53 sq mi (16.92 km2) |
| • Land | 5.50 sq mi (14.25 km2) |
| • Water | 1.03 sq mi (2.66 km2) |
| Elevation | 17 ft (5 m) |
| Population
(2020)
|
|
| • Total | 1,255 |
| • Density | 228.06/sq mi (88.05/km2) |
| ZIP codes |
29940
|
| Area code(s) | 843, 854 |
| FIPS code | 45-64690 |
Seabrook is a small community in Beaufort County, South Carolina, in the United States. It's a special kind of place called an "unincorporated community" and a "census-designated place" (CDP). This means it's a recognized area, but it doesn't have its own city government. In 2020, about 1,255 people lived there.
Seabrook is located in the northern part of Beaufort County. It sits along the Whale Branch River. The community started in the late 1700s. Back then, it was a group of large farms called plantations. Later, in the late 1800s, Seabrook became a stop on the Port Royal and Augusta Railway train line.
The downtown area of Seabrook used to be very busy. It had a federal Post Office, a general store, a gas station, and a train station. The local farms helped the economy grow. Today, the old businesses have mostly closed. This is because of new developments in the nearby city of Beaufort. However, the Post Office still serves the people who live in Seabrook. In the last ten years, three new public schools have opened in the area. One of these is Whale Branch Early College High School.
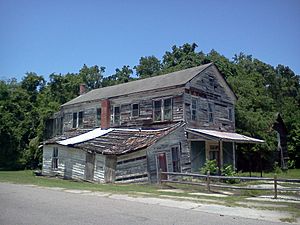
The McLeod Farmstead is an important historical site in Seabrook. It was added to the National Register of Historic Places in 1997. This means it's a special place worth preserving.
Who Lives in Seabrook?
| Historical population | |||
|---|---|---|---|
| Census | Pop. | %± | |
| 2020 | 1,255 | — | |
| U.S. decennial census 2020 |
|||
Seabrook's Population in 2020
The U.S. Census collects information about people living in different areas. This helps us understand who lives where. The table below shows the different groups of people living in Seabrook in 2020.
| Race / Ethnicity (NH = Not Hispanic) | Number of People in 2020 | Percentage in 2020 |
|---|---|---|
| White only (NH) | 395 | 31.47% |
| Black or African American only (NH) | 782 | 62.31% |
| Native American or Alaska Native only (NH) | 7 | 0.56% |
| Asian only (NH) | 7 | 0.56% |
| Pacific Islander only (NH) | 0 | 0.00% |
| Some Other Race only (NH) | 0 | 0.00% |
| Mixed Race or Multi-Racial (NH) | 19 | 1.51% |
| Hispanic or Latino (any race) | 45 | 3.59% |
| Total | 1,255 | 100.00% |
 | Charles R. Drew |
 | Benjamin Banneker |
 | Jane C. Wright |
 | Roger Arliner Young |


