Seibert, Colorado facts for kids
Quick facts for kids
Seibert, Colorado
|
|
|---|---|

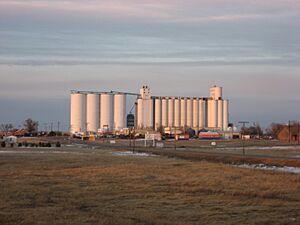
View from the south (2009)
|
|

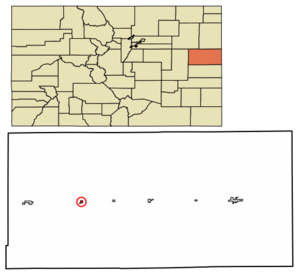
Location within Kit Carson County and Colorado
|
|
| Country | United States |
| State | Colorado |
| County | Kit Carson |
| Incorporated | June 21, 1917 |
| Government | |
| • Type | Statutory Town |
| Area | |
| • Total | 0.34 sq mi (0.89 km2) |
| • Land | 0.34 sq mi (0.89 km2) |
| • Water | 0.00 sq mi (0.00 km2) |
| Elevation | 4,712 ft (1,436 m) |
| Population
(2020)
|
|
| • Total | 172 |
| • Density | 506/sq mi (193.3/km2) |
| Time zone | UTC−7 (MST) |
| • Summer (DST) | UTC−6 (MDT) |
| ZIP Code |
80834
|
| Area code | 970 |
| FIPS code | 08-69040 |
| GNIS ID | 195118 |
Seibert is a small town in Kit Carson County, Colorado, United States. It is called a "statutory town" because it follows specific rules set by the state of Colorado. In 2020, about 172 people lived there.
Contents
A Look at Seibert's History
A post office opened in Seibert in 1888. This helped the community grow and connect with other places. The town was named after Henry Seibert, who worked for the railroad. On June 21, 1917, Seibert officially became an "incorporated" town. This means it gained the power to govern itself.
Where is Seibert Located?
Seibert is found in eastern Colorado. It is located at coordinates 39.299456 degrees north and 102.870204 degrees west. According to the United States Census Bureau, the town covers a total area of about 0.3 square miles (0.8 square kilometers). All of this area is land, with no water.
What's the Weather Like in Seibert?
Seibert has a climate with warm summers and cold winters. Here's a quick look at the weather:
| Climate data for Seibert, Colorado, 1991–2020 normals, extremes 2004–2022 | |||||||||||||
|---|---|---|---|---|---|---|---|---|---|---|---|---|---|
| Month | Jan | Feb | Mar | Apr | May | Jun | Jul | Aug | Sep | Oct | Nov | Dec | Year |
| Record high °F (°C) | 76 (24) |
80 (27) |
83 (28) |
88 (31) |
93 (34) |
107 (42) |
105 (41) |
100 (38) |
97 (36) |
90 (32) |
80 (27) |
73 (23) |
107 (42) |
| Mean maximum °F (°C) | 66.3 (19.1) |
66.5 (19.2) |
76.5 (24.7) |
82.9 (28.3) |
88.9 (31.6) |
98.1 (36.7) |
98.9 (37.2) |
96.5 (35.8) |
93.3 (34.1) |
84.9 (29.4) |
75.0 (23.9) |
66.3 (19.1) |
100.0 (37.8) |
| Mean daily maximum °F (°C) | 42.5 (5.8) |
44.8 (7.1) |
55.0 (12.8) |
62.5 (16.9) |
71.4 (21.9) |
83.0 (28.3) |
89.1 (31.7) |
85.0 (29.4) |
78.4 (25.8) |
65.0 (18.3) |
51.7 (10.9) |
42.6 (5.9) |
64.3 (17.9) |
| Daily mean °F (°C) | 28.8 (−1.8) |
30.6 (−0.8) |
39.9 (4.4) |
47.3 (8.5) |
57.1 (13.9) |
67.9 (19.9) |
74.0 (23.3) |
71.3 (21.8) |
63.6 (17.6) |
50.8 (10.4) |
38.1 (3.4) |
29.5 (−1.4) |
49.9 (9.9) |
| Mean daily minimum °F (°C) | 15.2 (−9.3) |
16.3 (−8.7) |
24.9 (−3.9) |
32.1 (0.1) |
42.9 (6.1) |
52.8 (11.6) |
59.0 (15.0) |
57.5 (14.2) |
48.8 (9.3) |
36.6 (2.6) |
24.4 (−4.2) |
16.3 (−8.7) |
35.6 (2.0) |
| Mean minimum °F (°C) | −3.3 (−19.6) |
−2.1 (−18.9) |
8.9 (−12.8) |
19.0 (−7.2) |
29.9 (−1.2) |
42.8 (6.0) |
50.9 (10.5) |
49.6 (9.8) |
35.5 (1.9) |
18.9 (−7.3) |
10.3 (−12.1) |
−3.8 (−19.9) |
−10.1 (−23.4) |
| Record low °F (°C) | −17 (−27) |
−24 (−31) |
−10 (−23) |
6 (−14) |
23 (−5) |
36 (2) |
46 (8) |
45 (7) |
27 (−3) |
1 (−17) |
−13 (−25) |
−18 (−28) |
−24 (−31) |
| Average precipitation inches (mm) | 0.28 (7.1) |
0.49 (12) |
1.01 (26) |
1.44 (37) |
2.69 (68) |
2.05 (52) |
2.64 (67) |
2.70 (69) |
1.10 (28) |
1.22 (31) |
0.39 (9.9) |
0.60 (15) |
16.61 (422) |
| Average snowfall inches (cm) | 3.8 (9.7) |
4.2 (11) |
5.8 (15) |
4.6 (12) |
0.8 (2.0) |
0.0 (0.0) |
0.0 (0.0) |
0.0 (0.0) |
0.0 (0.0) |
2.1 (5.3) |
2.4 (6.1) |
5.9 (15) |
29.6 (76.1) |
| Average precipitation days (≥ 0.01 in) | 2.9 | 3.0 | 3.9 | 5.2 | 8.0 | 5.0 | 7.4 | 7.2 | 4.4 | 4.2 | 2.8 | 3.5 | 57.5 |
| Average snowy days (≥ 0.1 in) | 2.6 | 2.5 | 2.6 | 2.0 | 0.2 | 0.0 | 0.0 | 0.0 | 0.0 | 0.7 | 2.0 | 3.2 | 15.8 |
| Source 1: NOAA | |||||||||||||
| Source 2: National Weather Service (mean maxima/minima 2006–2020) | |||||||||||||
Who Lives in Seibert?
The study of how many people live in a place is called "demographics." Every ten years, the United States counts its population in a "census." Here's how Seibert's population has changed over the years:
| Historical population | |||
|---|---|---|---|
| Census | Pop. | %± | |
| 1920 | 311 | — | |
| 1930 | 273 | −12.2% | |
| 1940 | 249 | −8.8% | |
| 1950 | 346 | 39.0% | |
| 1960 | 210 | −39.3% | |
| 1970 | 192 | −8.6% | |
| 1980 | 180 | −6.2% | |
| 1990 | 181 | 0.6% | |
| 2000 | 180 | −0.6% | |
| 2010 | 181 | 0.6% | |
| 2020 | 172 | −5.0% | |
| U.S. Decennial Census | |||
See also
 In Spanish: Seibert (Colorado) para niños
 | Tommie Smith |
 | Simone Manuel |
 | Shani Davis |
 | Simone Biles |
 | Alice Coachman |

