Shabbona, Illinois facts for kids
Quick facts for kids
Shabbona
|
|
|---|---|

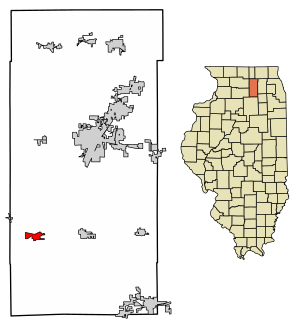
Location of Shabbona in DeKalb County, Illinois.
|
|

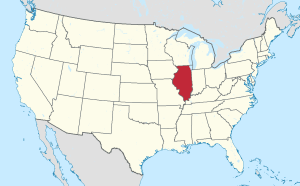
Location of Illinois in the United States
|
|
| Country | United States |
| State | Illinois |
| County | DeKalb |
| Area | |
| • Total | 1.28 sq mi (3.32 km2) |
| • Land | 1.28 sq mi (3.32 km2) |
| • Water | 0.00 sq mi (0.00 km2) |
| Population
(2020)
|
|
| • Total | 863 |
| • Density | 672.64/sq mi (259.80/km2) |
| Time zone | UTC-6 (CST) |
| • Summer (DST) | UTC-5 (CDT) |
| ZIP Code(s) |
60550
|
| Area codes | 815 & 779 |
| FIPS code | 17-68822 |
Shabbona is a small village located in DeKalb County, Illinois, in the United States. In 2020, about 863 people lived there. It's a quiet place with a rich history.
Contents
Exploring Shabbona's History
The village of Shabbona is named after an important person from the 1800s. This person was Shabonna, a chief of the Potawatomi people. He was known as a peacemaker.
Chief Shabbona: A Peacemaker
Chief Shabbona was famous for helping people. He traveled through the Fox Valley area. He warned the settlers about a coming war. This war was planned by another chief named Black Hawk. Because of his efforts to prevent conflict, Chief Shabbona was called the "Whiteman's Friend."
Where is Shabbona Located?
Shabbona is found in northern Illinois. It is located at coordinates 41.767381 degrees North and -88.874677 degrees West.
Nearby Natural Attractions
A popular spot near the village is Shabbona Lake State Park. This park offers many outdoor activities. The village itself covers about 1.28 square miles (3.32 square kilometers) of land. Almost all of this area is land, with very little water.
Who Lives in Shabbona?
The population of Shabbona has changed over the years. In 2020, the village had 863 residents. This was a small decrease from 925 people in 2010.
Population Changes Over Time
Here's how the number of people living in Shabbona has changed:
| Historical population | |||
|---|---|---|---|
| Census | Pop. | %± | |
| 1880 | 399 | — | |
| 1890 | 502 | 25.8% | |
| 1900 | 587 | 16.9% | |
| 1910 | 594 | 1.2% | |
| 1920 | 735 | 23.7% | |
| 1930 | 546 | −25.7% | |
| 1940 | 593 | 8.6% | |
| 1950 | 667 | 12.5% | |
| 1960 | 690 | 3.4% | |
| 1970 | 730 | 5.8% | |
| 1980 | 851 | 16.6% | |
| 1990 | 897 | 5.4% | |
| 2000 | 929 | 3.6% | |
| 2010 | 925 | −0.4% | |
| 2020 | 863 | −6.7% | |
| U.S. Decennial Census | |||
A Look at Shabbona's Households
In 2020, there were 366 households in Shabbona. About 23% of these households had children under 18 living there. Many households were married couples living together. Some households had a female head without a husband. About 35% of all households were individuals living alone. Almost 20% of households had someone aged 65 or older living by themselves.
The average household had about 3 people. The average family had about 2.35 people.
Age Groups in the Village
The people in Shabbona come from different age groups:
- 15% were under 18 years old.
- 12.6% were between 18 and 24 years old.
- 17.8% were between 25 and 44 years old.
- 30% were between 45 and 64 years old.
- 24.4% were 65 years or older.
The average age of people in Shabbona was 49.2 years. For every 100 females, there were about 90 males.
Income and Economy
The average income for a household in Shabbona was $66,250. For families, the average income was $86,711. The average income per person in the village was $30,966. A small number of families and people lived below the poverty line. This included about 2.9% of those under 18 and 9.5% of those 65 or older.
See also
 In Spanish: Shabbona para niños
 | Emma Amos |
 | Edward Mitchell Bannister |
 | Larry D. Alexander |
 | Ernie Barnes |

