South Point, Ohio facts for kids
Quick facts for kids
South Point, Ohio
|
|
|---|---|
|
Village
|
|

South Point Welcome Sign
|
|

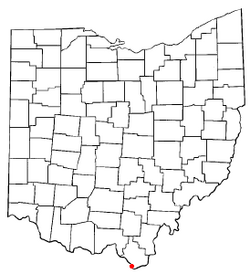
Location of South Point, Ohio
|
|

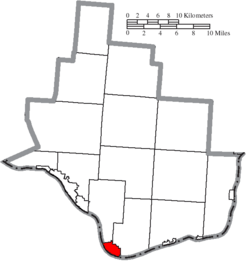
Location of South Point in Lawrence County
|
|
| Country | United States |
| State | Ohio |
| County | Lawrence |
| Townships | Perry, Fayette |
| Area | |
| • Total | 3.23 sq mi (8.38 km2) |
| • Land | 2.94 sq mi (7.63 km2) |
| • Water | 0.29 sq mi (0.75 km2) |
| Elevation | 597 ft (182 m) |
| Population
(2020)
|
|
| • Total | 3,836 |
| • Density | 1,302.55/sq mi (502.99/km2) |
| Time zone | UTC-5 (Eastern (EST)) |
| • Summer (DST) | UTC-4 (EDT) |
| ZIP code |
45680
|
| Area code(s) | 740 |
| FIPS code | 39-73670 |
| GNIS feature ID | 2399853 |
South Point is a small village located in Lawrence County, Ohio, United States. It sits right along the Ohio River. In 2020, about 3,836 people lived there. South Point is special because it is the southernmost town in the entire state of Ohio! It is also part of the larger Huntington–Ashland metropolitan area, which includes parts of Kentucky and West Virginia.
Contents
History of South Point
South Point got its name because it contains the southernmost point in the state of Ohio. A post office has been operating here since 1855. There was once a community nearby called North Kenova. This community was named because it was located on the opposite side of the Ohio River from Kenova, West Virginia.
Geography and Location
South Point is located at a unique spot where three states meet: Ohio, West Virginia, and Kentucky. The southernmost point in Ohio is found near the village, along the Ohio River.
Land and Water Area
According to the United States Census Bureau, the village covers a total area of about 3.23 square miles (8.38 square kilometers). Most of this area, about 2.94 square miles (7.63 square kilometers), is land. The remaining 0.29 square miles (0.75 square kilometers) is water.
Climate in South Point
South Point experiences a typical climate for its region. Here's a look at the average temperatures and rainfall:
| Climate data for South Point, Ohio, 1991–2020 normals, extremes 1990–present | |||||||||||||
|---|---|---|---|---|---|---|---|---|---|---|---|---|---|
| Month | Jan | Feb | Mar | Apr | May | Jun | Jul | Aug | Sep | Oct | Nov | Dec | Year |
| Record high °F (°C) | 76 (24) |
80 (27) |
87 (31) |
91 (33) |
94 (34) |
104 (40) |
105 (41) |
104 (40) |
98 (37) |
95 (35) |
88 (31) |
77 (25) |
105 (41) |
| Mean maximum °F (°C) | 66.3 (19.1) |
70.2 (21.2) |
77.2 (25.1) |
84.4 (29.1) |
88.6 (31.4) |
92.5 (33.6) |
94.7 (34.8) |
93.4 (34.1) |
90.9 (32.7) |
83.9 (28.8) |
76.2 (24.6) |
67.2 (19.6) |
96.0 (35.6) |
| Mean daily maximum °F (°C) | 42.5 (5.8) |
46.2 (7.9) |
55.8 (13.2) |
67.9 (19.9) |
75.7 (24.3) |
83.4 (28.6) |
86.4 (30.2) |
85.5 (29.7) |
79.8 (26.6) |
68.9 (20.5) |
56.7 (13.7) |
46.4 (8.0) |
66.3 (19.0) |
| Daily mean °F (°C) | 33.6 (0.9) |
36.3 (2.4) |
44.6 (7.0) |
55.1 (12.8) |
64.5 (18.1) |
73.0 (22.8) |
76.4 (24.7) |
75.2 (24.0) |
68.7 (20.4) |
57.1 (13.9) |
45.7 (7.6) |
37.7 (3.2) |
55.7 (13.2) |
| Mean daily minimum °F (°C) | 24.6 (−4.1) |
26.5 (−3.1) |
33.4 (0.8) |
42.4 (5.8) |
53.3 (11.8) |
62.6 (17.0) |
66.4 (19.1) |
64.9 (18.3) |
57.6 (14.2) |
45.3 (7.4) |
34.6 (1.4) |
29.0 (−1.7) |
45.1 (7.2) |
| Mean minimum °F (°C) | 5.6 (−14.7) |
8.9 (−12.8) |
15.8 (−9.0) |
26.8 (−2.9) |
36.5 (2.5) |
49.3 (9.6) |
55.5 (13.1) |
53.8 (12.1) |
43.3 (6.3) |
30.6 (−0.8) |
19.5 (−6.9) |
12.8 (−10.7) |
2.2 (−16.6) |
| Record low °F (°C) | −21 (−29) |
−15 (−26) |
−6 (−21) |
18 (−8) |
26 (−3) |
36 (2) |
46 (8) |
45 (7) |
32 (0) |
19 (−7) |
8 (−13) |
3 (−16) |
−21 (−29) |
| Average precipitation inches (mm) | 3.51 (89) |
3.55 (90) |
4.59 (117) |
4.19 (106) |
4.85 (123) |
4.54 (115) |
5.65 (144) |
4.08 (104) |
3.88 (99) |
3.30 (84) |
3.19 (81) |
4.15 (105) |
49.48 (1,257) |
| Average snowfall inches (cm) | 3.2 (8.1) |
1.2 (3.0) |
0.8 (2.0) |
0.0 (0.0) |
0.0 (0.0) |
0.0 (0.0) |
0.0 (0.0) |
0.0 (0.0) |
0.0 (0.0) |
0.0 (0.0) |
0.1 (0.25) |
0.9 (2.3) |
6.2 (15.65) |
| Average precipitation days (≥ 0.01 in) | 13.6 | 12.1 | 13.5 | 13.5 | 13.8 | 12.3 | 11.8 | 9.7 | 8.8 | 9.5 | 11.3 | 13.0 | 142.9 |
| Average snowy days (≥ 0.1 in) | 2.2 | 1.3 | 0.6 | 0.0 | 0.0 | 0.0 | 0.0 | 0.0 | 0.0 | 0.0 | 0.1 | 0.7 | 4.9 |
| Source 1: NOAA | |||||||||||||
| Source 2: National Weather Service | |||||||||||||
Population and People
The population of South Point has changed over the years. Here's how it has grown:
| Historical population | |||
|---|---|---|---|
| Census | Pop. | %± | |
| 1900 | 281 | — | |
| 1910 | 316 | 12.5% | |
| 1920 | 406 | 28.5% | |
| 1930 | 499 | 22.9% | |
| 1940 | 605 | 21.2% | |
| 1950 | 804 | 32.9% | |
| 1960 | 1,663 | 106.8% | |
| 1970 | 2,910 | 75.0% | |
| 1980 | 3,918 | 34.6% | |
| 1990 | 3,823 | −2.4% | |
| 2000 | 3,742 | −2.1% | |
| 2010 | 3,958 | 5.8% | |
| 2020 | 3,836 | −3.1% | |
| U.S. Decennial Census | |||
2010 Census Information
In 2010, there were 3,958 people living in South Point. These people lived in 1,602 households, with 1,132 of these being families. The village had about 1,346 people per square mile.
Most of the people living in South Point were White (94.2%). There were also African American (3.2%), Asian (0.5%), and Native American (0.1%) residents. About 1.8% of the population identified as two or more races. A small number, 0.4%, were of Hispanic or Latino background.
About one-third of the households (33.0%) had children under 18 living with them. More than half (53.1%) were married couples. About 10.5% of households had someone aged 65 or older living alone. The average age of people in the village was 40.3 years old.
Education in South Point
The South Point Local School District serves the students in the village and nearby areas. In 2004, the school district started a big project to build new school buildings. For example, the new South Point Elementary School was built where the old middle and high schools used to be.
South Point also has a public library. It is a branch of the Briggs Lawrence County Public Library, where kids and adults can borrow books and learn new things.
See also
 In Spanish: South Point (Ohio) para niños

