St. Bonaventure, New York facts for kids
Quick facts for kids
St. Bonaventure, New York
|
|
|---|---|
| Country | United States |
| State | New York |
| County | Cattaraugus |
| Town | Allegany |
| Area | |
| • Total | 2.06 sq mi (5.33 km2) |
| • Land | 1.91 sq mi (4.94 km2) |
| • Water | 0.15 sq mi (0.39 km2) |
| Elevation | 1,427 ft (435 m) |
| Population
(2020)
|
|
| • Total | 1,963 |
| • Density | 1,029.91/sq mi (397.62/km2) |
| Time zone | UTC-5 (Eastern (EST)) |
| • Summer (DST) | UTC-4 (EDT) |
| FIPS code | 36-64551 |
| GNIS feature ID | 1867415 |
St. Bonaventure is a small community in New York, United States. It is known as a hamlet and a census-designated place (CDP). A CDP is a special area that the government counts for population, but it's not a city or town with its own local government.
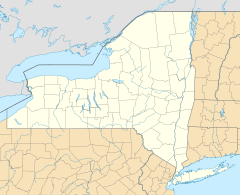
This community is found in Cattaraugus County. It sits between the village of Allegany and the city of Olean. St. Bonaventure is built around St. Bonaventure University.
In 2020, about 1,963 people lived here. Because many people in St. Bonaventure are college students, the average income might look lower than in other towns. St. Bonaventure also has its own post office and ZIP code (14778) right on the university campus.
Contents
St. Bonaventure is located in western New York state. Its exact coordinates are 42°4'49" North and 78°28'30" West.
New York State Route 417 is a main road that goes through the community. The area is just north of the Allegheny River. It is also south of the Southern Tier Expressway, a major highway.
The total area of St. Bonaventure is about 2.1 square miles (5.5 square kilometers). Most of this area is land, about 1.9 square miles (5.1 square kilometers). The rest, about 0.15 square miles (0.4 square kilometers), is water.
The population of St. Bonaventure has changed a little over the years. In 2010, there were 2,044 people living here. By 2020, the population was 1,963.
The people living in St. Bonaventure come from many different backgrounds. Here's a look at the main groups in 2020:
- Most residents, about 82.68%, are White.
- About 7.79% of the population is Black or African American.
- Around 3.06% are Asian.
- About 1.58% are of Mixed Race.
- A small number, 0.15%, are Native American or Alaska Native.
- People who identify as Hispanic or Latino make up about 4.74% of the population. They can be of any race.
See also

- In Spanish: St. Bonaventure para niños
 | Stephanie Wilson |
 | Charles Bolden |
 | Ronald McNair |
 | Frederick D. Gregory |


