St. James, North Carolina facts for kids
Quick facts for kids
St. James, North Carolina
|
||
|---|---|---|
|
||
| Country | United States | |
| State | North Carolina | |
| County | Brunswick | |
| Area | ||
| • Total | 9.20 sq mi (23.83 km2) | |
| • Land | 9.11 sq mi (23.60 km2) | |
| • Water | 0.09 sq mi (0.22 km2) | |
| Elevation | 56 ft (17 m) | |
| Population
(2020)
|
||
| • Total | 6,529 | |
| • Density | 716.37/sq mi (276.60/km2) | |
| Time zone | UTC-5 (Eastern (EST)) | |
| • Summer (DST) | UTC-4 (EDT) | |
| FIPS code | 37-58630 | |
| GNIS feature ID | 2407392 | |
St. James or Saint James is a town located in Brunswick County, North Carolina, in the United States. It has grown quite a bit over the years. In 2000, about 804 people lived there. By 2010, the population had grown to 3,165. The town is part of the larger Wilmington area.
Contents
Where is St. James, North Carolina?
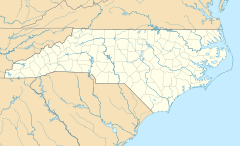
St. James is in the southern part of Brunswick County. It is surrounded on three sides by the town of Oak Island. A major road, North Carolina Highway 211, runs along part of its northern edge. This highway can take you about 5 miles (8 km) east to Southport. If you go about 11 miles (18 km) west, you'll reach U.S. Route 17 near Supply.
Land and Water in St. James
The town of St. James covers a total area of about 8.3 square miles (21.5 square kilometers). Most of this area is land, about 8.3 square miles (21.4 square kilometers). A very small part, about 0.04 square miles (0.1 square kilometers), is water.
Who Lives in St. James?
The number of people living in St. James has increased a lot over the past two decades. This section shares details about the population based on official counts.
Population Growth Over Time
The table below shows how the population of St. James has changed during different census years.
| Historical population | |||
|---|---|---|---|
| Census | Pop. | %± | |
| 2000 | 804 | — | |
| 2010 | 3,165 | 293.7% | |
| 2020 | 6,529 | 106.3% | |
| U.S. Decennial Census | |||
A Look at the People (2020)
As of the 2020 United States census, there were 6,529 people living in St. James. These people made up 2,713 households and 2,458 families. Most residents are White, making up about 95.85% of the population. Other groups include African American, Native American, Asian, Pacific Islander, and people of mixed races. About 1.16% of the population identified as Hispanic or Latino.
| Race | Number | Percentage |
|---|---|---|
| White (non-Hispanic) | 6,258 | 95.85% |
| Black or African American (non-Hispanic) | 27 | 0.41% |
| Native American | 5 | 0.08% |
| Asian | 51 | 0.78% |
| Pacific Islander | 1 | 0.02% |
| Other/Mixed | 111 | 1.7% |
| Hispanic or Latino | 76 | 1.16% |
Community Life (2010)
In 2010, there were 3,165 people in St. James. There were 1,575 households and 1,386 families. The town had 2,263 housing units. Most households (86.3%) were married couples living together. Only a small number (3.0%) had children under 18. About 10.4% of households were individuals living alone. Many of these (6.0%) were people aged 65 or older.
The population of St. James tends to be older. In 2010, nearly half (49.8%) of the residents were 65 years or older. About 43.4% were between 45 and 64 years old. Only a small percentage (2.5%) were under 18. The average age in the town was 65.0 years.
The estimated average yearly income for a household in St. James was about $82,476 between 2008 and 2012. For families, the average income was around $83,750. The average income per person in the town was about $67,796. A very small number of people, about 1.2%, lived below the poverty line.
See also
 In Spanish: St. James (Carolina del Norte) para niños
 | James Van Der Zee |
 | Alma Thomas |
 | Ellis Wilson |
 | Margaret Taylor-Burroughs |


