St. Libory, Illinois facts for kids
Quick facts for kids
St. Libory
|
|
|---|---|
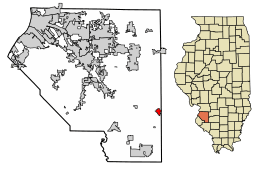
Location of St. Libory in Clair County, Illinois.
|
|
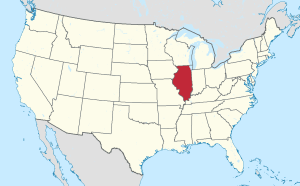
Location of Illinois in the United States
|
|
| Country | United States |
| State | Illinois |
| County | St. Clair |
| Area | |
| • Total | 0.97 sq mi (2.52 km2) |
| • Land | 0.97 sq mi (2.52 km2) |
| • Water | 0.00 sq mi (0.00 km2) |
| Elevation | 417 ft (127 m) |
| Population
(2020)
|
|
| • Total | 628 |
| • Density | 646.09/sq mi (249.42/km2) |
| Time zone | UTC-6 (CST) |
| • Summer (DST) | UTC-5 (CDT) |
| ZIP Code(s) |
62282
|
| Area code(s) | 618 |
| FIPS code | 17-66989 |
| GNIS feature ID | 2399167 |
| Wikimedia Commons | St. Libory, Illinois |
St. Libory or Saint Libory is a small village located in St. Clair County, Illinois, in the United States. It is a quiet community where people live and work. In 2020, about 628 people called St. Libory home.
Contents
Where is St. Libory Located?
St. Libory is found in the state of Illinois. It is part of St. Clair County. The village is located at these coordinates: 38°21′52″N 89°42′51″W / 38.36444°N 89.71417°W. This helps pinpoint its exact spot on a map.
How Big is St. Libory?
According to information from 2010, the village of St. Libory covers a total area of about 0.95 square miles (2.5 square kilometers). All of this area is land, meaning there are no large lakes or rivers within the village limits.
Who Lives in St. Libory?
The number of people living in St. Libory has changed over the years. Here's a quick look at how the population has grown:
| Historical population | |||
|---|---|---|---|
| Census | Pop. | %± | |
| 1900 | 220 | — | |
| 1910 | 328 | 49.1% | |
| 1920 | 289 | −11.9% | |
| 1930 | 269 | −6.9% | |
| 1940 | 296 | 10.0% | |
| 1950 | 324 | 9.5% | |
| 1960 | 346 | 6.8% | |
| 1970 | 448 | 29.5% | |
| 1980 | 549 | 22.5% | |
| 1990 | 525 | −4.4% | |
| 2000 | 583 | 11.0% | |
| 2010 | 615 | 5.5% | |
| 2020 | 628 | 2.1% | |
| U.S. Decennial Census | |||
What Was the Population Like in 2000?
In the year 2000, there were 583 people living in St. Libory. These people lived in 213 different homes, and 158 of these were families. The village had about 618 people per square mile.
Homes and Families
- About 40.8% of homes had children under 18 living there.
- Most homes (60.1%) were married couples living together.
- About 10.3% of homes had a female head of household without a husband.
- About 22.5% of all homes were single individuals.
- Around 12.2% of homes had someone aged 65 or older living alone.
- The average number of people in a home was 2.74.
- The average number of people in a family was 3.23.
Age Groups in St. Libory
The people in St. Libory in 2000 were of different ages:
- 28.6% were under 18 years old.
- 7.9% were between 18 and 24 years old.
- 28.5% were between 25 and 44 years old.
- 20.8% were between 45 and 64 years old.
- 14.2% were 65 years old or older.
The average age in the village was 36 years.
Income and Poverty
In 2000, the average income for a household in St. Libory was $50,625 per year. For families, the average income was $56,625. The average income per person in the village was $20,024. A small number of families (3.5%) and people (6.0%) lived below the poverty line. This included 8.6% of those under 18 and 6.5% of those 65 or older.
What are the Historic Places in St. Libory?
St. Libory has a special place that is listed as a historic site:
- Rutter Store
See also
 In Spanish: St. Libory para niños
 | James Van Der Zee |
 | Alma Thomas |
 | Ellis Wilson |
 | Margaret Taylor-Burroughs |

