St Marylebone (UK Parliament constituency) facts for kids
Quick facts for kids {{{Name}}}[[{{{Type}}} constituency]] |
|
|---|---|
| [[Image:{{{Map1}}}Constituency.svg|120px|]] [[Image:England{{{Map2}}}.svg|120px|]] |
|
| {{{Name}}} shown within [[{{{Entity}}}]], and {{{Entity}}} shown within England | |
| Created: | {{{Year}}} |
| MP: | {{{MP}}} |
| Party: | {{{Party}}} |
| Type: | House of Commons |
| County: | [[{{{County}}}]] |
| EP constituency: | [[{{{EP}}} (European Parliament constituency)|{{{EP}}}]] |
St Marylebone was a special area in Central London that elected one person to represent it in the House of Commons. This person is called a Member of Parliament (MP).
This area was created for the election in 1918. It stopped being a separate area for elections in 1983.
Contents
What Was St Marylebone?
A parliamentary constituency is like a voting district. People living in St Marylebone voted for their chosen MP. This MP would then speak for their area in the UK Parliament.
St Marylebone was located in the famous Marylebone district of London. It was known as a "borough" constituency. This means it was mainly a town or city area.
Where Were the Boundaries?
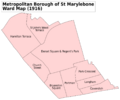
The boundaries of St Marylebone changed a few times over the years. These changes were usually small. They were based on the different wards (smaller local areas) within the Metropolitan Borough of St Marylebone and later the City of Westminster.
- From 1918 to 1950: The area included wards like Bryanston Square, Cavendish, Church Street, Dorset Square and Regent's Park, Hamilton Terrace, Langham, Park Crescent, Portman, and St John's Wood Terrace.
- From 1950 to 1974: The area changed slightly. It included wards such as Bell Street, Bryanston Square, Cavendish Square, Church Street, Dorset Square, Hamilton Terrace, Lord's, Park Crescent, Portman Square, and St John's Wood Terrace.
- From 1974 to 1983: The boundaries were updated again. This time, it covered the City of Westminster wards of Baker Street, Cavendish, Church Street, Lord's, and Regent's Park.
Even with these changes, the main shape of the constituency stayed mostly the same.
Who Were the Members of Parliament?
The people who represented St Marylebone in Parliament were all from the Conservative Party or its earlier version, the Unionist Party. This shows that St Marylebone was a strong area for these parties.
Here are the MPs who represented St Marylebone:
| Year | Member | Party | |
|---|---|---|---|
| 1918 | Sir Samuel Scott | Unionist | |
| 1922 | Sir Douglas Hogg | Unionist | |
| 1928 | Sir Rennell Rodd | Unionist | |
| 1932 | Alec Cunningham-Reid | Conservative | |
| 1945 | Sir Wavell Wakefield | Conservative | |
| 1963 | Quintin Hogg | Conservative | |
| 1970 | Kenneth Baker | Conservative | |
| 1983 | constituency abolished | ||
How Elections Worked
Elections in St Marylebone happened just like in other parts of the UK. People voted for their preferred candidate. The candidate with the most votes became the MP.
Sometimes, an MP would leave their job before the next general election. When this happened, a special election called a "by-election" was held. This allowed the people of St Marylebone to choose a new MP right away.
The election results show how many people voted for each party. They also show the "majority," which is how many more votes the winner got than the second-place candidate. The "turnout" tells us what percentage of people actually voted.
Images for kids
 | Jackie Robinson |
 | Jack Johnson |
 | Althea Gibson |
 | Arthur Ashe |
 | Muhammad Ali |


