Sugar Grove, Ohio facts for kids
Quick facts for kids
Sugar Grove, Ohio
|
|
|---|---|
|
Village
|
|
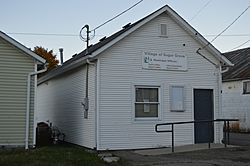
Village Hall
|
|
| Nickname(s):
Gateway to the Hocking Hills, The Grove, SG
|
|
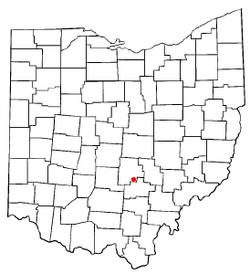
Location of Sugar Grove, Ohio
|
|
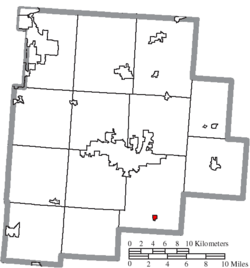
Location of Sugar Grove in Fairfield County
|
|
| Country | United States |
| State | Ohio |
| County | Fairfield |
| Government | |
| • Type | Mayor-council |
| Area | |
| • Total | 0.32 sq mi (0.83 km2) |
| • Land | 0.31 sq mi (0.80 km2) |
| • Water | 0.01 sq mi (0.03 km2) |
| Elevation | 781 ft (238 m) |
| Population
(2020)
|
|
| • Total | 429 |
| • Density | 1,397.39/sq mi (539.47/km2) |
| Time zone | UTC-5 (Eastern (EST)) |
| • Summer (DST) | UTC-4 (EDT) |
| ZIP code |
43155
|
| Area code(s) | 740 |
| FIPS code | 39-75252 |
| GNIS feature ID | 1060971 |
Sugar Grove is a small village located in Fairfield County, Ohio, in the United States. It's a quiet community with a rich history. In 2020, about 429 people lived there.
Contents
A Look Back: Sugar Grove's History
Sugar Grove got its name from a special group of sugar maple trees that grew nearby when the town was first settled. These trees are famous for their sweet sap, which is used to make maple syrup!
In recent years, Sugar Grove has hosted a fun event called "Dude's Weekend." It's a community celebration that brings people together.
Exploring Sugar Grove's Geography
Geography helps us understand where a place is and what its land looks like. Sugar Grove is a small village.
According to information from the United States Census Bureau, the village covers a total area of about 0.83 square kilometers (0.32 square miles). Most of this area, about 0.80 square kilometers (0.31 square miles), is land. A very small part, about 0.03 square kilometers (0.01 square miles), is water.
Who Lives in Sugar Grove: Demographics
Demographics is a way to study the people who live in a place. It looks at things like how many people there are, their ages, and how households are formed.
| Historical population | |||
|---|---|---|---|
| Census | Pop. | %± | |
| 1870 | 254 | — | |
| 1880 | 262 | 3.1% | |
| 1890 | 275 | 5.0% | |
| 1900 | 350 | 27.3% | |
| 1910 | 368 | 5.1% | |
| 1920 | 420 | 14.1% | |
| 1930 | 388 | −7.6% | |
| 1940 | 429 | 10.6% | |
| 1950 | 434 | 1.2% | |
| 1960 | 479 | 10.4% | |
| 1970 | 469 | −2.1% | |
| 1980 | 407 | −13.2% | |
| 1990 | 465 | 14.3% | |
| 2000 | 448 | −3.7% | |
| 2010 | 426 | −4.9% | |
| 2020 | 429 | 0.7% | |
| U.S. Decennial Census | |||
Population Details from 2010
In 2010, there were 426 people living in Sugar Grove. These people lived in 155 different homes, and 123 of these were families.
Most of the people in the village were White (98.1%). A small number were Native American (1.4%) or from two or more races (0.5%). About 0.5% of the population identified as Hispanic or Latino.
Many homes (50.3%) had children under 18 living there. About 47.7% of homes were married couples living together. Some homes had a female head of household without a husband (25.2%), or a male head of household without a wife (6.5%). About 20.6% of homes were not families.
The average age of people in the village was about 34.8 years old. About 30.8% of residents were under 18. People aged 18 to 24 made up 9.3% of the population, while those 25 to 44 were 27.2%. People aged 45 to 64 were 26%, and 6.6% were 65 or older. The village had a nearly even split of genders, with 50.2% male and 49.8% female residents.
See also
 In Spanish: Sugar Grove (Ohio) para niños
 | Selma Burke |
 | Pauline Powell Burns |
 | Frederick J. Brown |
 | Robert Blackburn |

