Tatum, New Mexico facts for kids
Quick facts for kids
Tatum, New Mexico
|
|
|---|---|

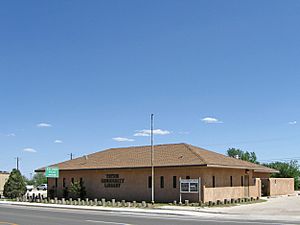
Tatum Community Library, May 2009
|
|

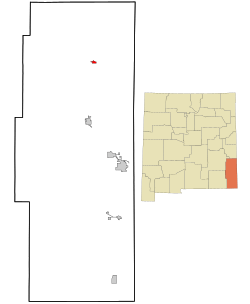
Location of Tatum in Lea County
|
|
| Country | United States |
| State | New Mexico |
| County | Lea |
| Area | |
| • Total | 1.59 sq mi (4.12 km2) |
| • Land | 1.58 sq mi (4.11 km2) |
| • Water | 0.01 sq mi (0.02 km2) |
| Elevation | 3,996 ft (1,218 m) |
| Population
(2020)
|
|
| • Total | 706 |
| • Density | 445.43/sq mi (171.96/km2) |
| Time zone | UTC-7 (Mountain (MST)) |
| • Summer (DST) | UTC-6 (MDT) |
| ZIP codes |
88213, 88267
|
| Area code(s) | 575 |
| FIPS code | 35-76620 |
| GNIS feature ID | 2413367 |
Tatum is a small town located in Lea County, New Mexico, in the United States. In 2020, about 706 people lived there. The town is known for its quiet, rural setting in the eastern part of the state.
Contents
Geography of Tatum
Tatum is found in the northern part of Lea County. A main road, U.S. Route 380, goes right through the town. This road can take you about 72 miles west to Roswell. Or, if you go east, it's about 30 miles to Plains, Texas.
Another important road, New Mexico State Road 206, crosses US 380 in the middle of Tatum. Heading north on State Road 206, you can reach Portales in about 65 miles. Going south for about 22 miles will take you to Lovington. Lovington is the main town for Lea County, called the county seat.
The town of Tatum covers a total area of about 1.59 square miles (4.1 square kilometers). Only a very small part of this area is water.
Tatum's Climate
Tatum has a type of weather called a cold semi-arid climate. This means it's generally dry, but not a true desert. It can get quite cold in winter and very hot in summer.
The hottest temperature ever recorded in Tatum was 115°F (46°C). This happened on June 28, 1994. The coldest temperature recorded was -16°F (-27°C). This extreme cold happened on two different dates: January 11, 1962, and January 13, 1963.
Population Changes in Tatum
The number of people living in Tatum has changed over the years.
| Historical population | |||
|---|---|---|---|
| Census | Pop. | %± | |
| 1950 | 688 | — | |
| 1960 | 1,168 | 69.8% | |
| 1970 | 982 | −15.9% | |
| 1980 | 896 | −8.8% | |
| 1990 | 768 | −14.3% | |
| 2000 | 683 | −11.1% | |
| 2010 | 798 | 16.8% | |
| 2020 | 706 | −11.5% | |
| U.S. Decennial Census | |||
In the year 2000, there were 683 people living in Tatum. By 2010, the population grew to 798 people. However, the most recent count in 2020 showed the population had decreased slightly to 706 people.
Getting Around Tatum
Tatum Airport
Tatum has its own small airport called Tatum Airport. It is owned by the town and is open for public use. The airport is located about 3 nautical miles (6 kilometers) east of the town's main area.
Major Roads
Images for kids
See also
 In Spanish: Tatum (Nuevo México) para niños
 | Stephanie Wilson |
 | Charles Bolden |
 | Ronald McNair |
 | Frederick D. Gregory |


