Timbiquí facts for kids
Quick facts for kids
Timbiqui, Cauca
|
|
|---|---|
|
Municipality and town
|
|

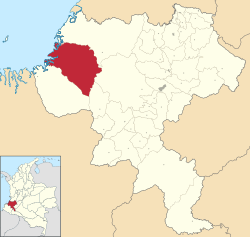
Location of the municipality and town of Timbiqui, Cauca in the Cauca Department of Colombia.
|
|
| Country | |
| Department | Cauca Department |
| Population
(Census 2018)
|
|
| • Total | 21,618 |
| Time zone | UTC-5 (Colombia Standard Time) |
| Climate | Af |
Timbiquí is a town and a type of local government area called a municipality in the Cauca Department, Colombia. It is located on Colombia's Pacific Coast. The town sits right where the Timbiquí River meets the ocean.
On October 1, 2012, an earthquake affected the people living in Timbiquí.
Contents
History of Timbiquí
The town of Timbiquí was started in 1772. Two mine owners, Francisco Mosquera and Andrés Saa, set aside land for it. The town was first named Santa Bárbara.
Timbiquí became an official municipality in 1915. This happened as Colombia began to organize its Pacific coast towns. There was a disagreement with a large company called The New Timbiquí Gold Mines, Ltd. This company claimed to own the whole town and its gold mines.
Early Inhabitants and Explorers
The first people to live in the Timbiquí area were Embera indigenous groups. They lived along the rivers of the Colombian Pacific coast. This area is west of the Western Mountain Range. It is also known as the biogeographic Chocó region.
Pascual de Andagoya was the first European to explore this area in 1540. He reported seeing many indigenous people. Their large houses were built on stilts, which the Spanish called "Barbacoas." These stilt houses were very common near the Patía River. Because of this, the region from the Saija and Timbiquí rivers to the Mira river was called "Province of Las Barbacoas."
During the 1500s, other explorers came from the town of Popayán. Records from 1541 to 1545 mention two indigenous groups. One was called Tama, Tamayo, or Tamay. The other was called Petres. The Tamay group lived along the Timbiquí River. They were known as strong warriors who had fought off Spanish forces before. The name Timbiquí likely comes from the old Tamay River.
Gold Discovery and Changes
In 1634, the Spanish found rich gold deposits in the region. They then named the river, its basin, and the entire area "Timbiquí." This district stretched south to the Tumaco Cove.
The Petres group lived along the Guapi River. They traded goods with towns near Popayán.
When gold was discovered, indigenous people were forced to work in the mines. This continued until the late 1600s. By then, most indigenous people were gone. They were replaced by enslaved people brought from Africa.
More Black people moved to the region after slavery ended in 1851. This sometimes caused distrust with indigenous groups. However, over time, Black and indigenous people worked together. They formed "maroon societies" in the 1700s and 1800s. These groups helped people escape forced labor. They survived the rainforest by combining their skills. They farmed, hunted, fished, and extracted gold and timber.
In 1902, a British company called The New Timbiquí Gold Mines Ltd. got permission to mine gold. By the 1920s, this company gained control of large areas of land. This made it hard for local communities to live on their traditional lands. They even needed special permission to use old mining methods.
Geography
Timbiquí municipality covers an area of 1,813 square kilometers. It is about five meters above sea level. The town is 580 kilometers west of Popayán.
Timbiquí shares borders with:
- López de Micay to the north
- El Tambo, Cauca and Argelia, Cauca to the east
- Guapi to the south
- The Pacific Ocean to the west
About 70% of the municipality has mountains and flat areas. The average temperature is around 28°C (82°F).
The region has many rivers. Important rivers like the Guapi, Timbiquí, Saija, and Napi flow from the Western Mountain Range. Their waters flow into the Pacific Ocean through many small channels and estuaries. These areas are rich in mangrove trees.
Near the river mouths and out at sea, there are many small and medium-sized fish. Local people catch these fish using traditional methods. The area is a very humid tropical forest. It gets between 4,000 and 8,000 mm of rain each year. The average temperature is 29°C (84°F). The eastern part of the region has hills and mountains. Some peaks reach 3,000 meters (9,800 feet) high.
Demographics
In 2020, Timbiquí municipality had about 26,607 people. About 50.5% were men and 49.5% were women.
Most of the people in Timbiquí identify as:
- 76.8% Black, Mulatto, or Afro-Colombian
- 9.23% Indigenous
- 11% Mestizo (mixed heritage)
A large part of the population is young. About 55.6% of the people are under 25 years old. This means the local government needs to focus on providing services for children, teenagers, and young adults.
Administrative Division
The municipality of Timbiquí includes the following towns or corregimientos (small local districts):
- Angostura
- Boca de Patía
- Bubuey
- Cabecital
- Camarones
- Chete
- Corozal
- Coteje
- Cupi
- El Charco
- El Realito
- Guangui
- Los Brasos
- Pizare
- Puerto Saija
- San Bernardo
- San José
- San Miguel
- Santa María
- Santa Rosa de Saija
Economy
For a long time, Timbiquí's economy has depended on mining. Since the Spanish arrived, this Pacific area was important for gold and silver mining.
Besides mining, the economy also relies on farming. People grow basic crops like rice, corn, coconut, and bananas. Artisanal fishing is also very important. Cane and coconut are key products that people trade with other towns. These products also help local families earn money.
Climate
Like the rest of Colombia's Pacific coast, Timbiquí has a very wet tropical rainforest climate. This is known as Af in the Köppen climate classification.
| Climate data for Timbiquí | |||||||||||||
|---|---|---|---|---|---|---|---|---|---|---|---|---|---|
| Month | Jan | Feb | Mar | Apr | May | Jun | Jul | Aug | Sep | Oct | Nov | Dec | Year |
| Mean daily maximum °C (°F) | 29.1 (84.4) |
29.9 (85.8) |
30.2 (86.4) |
29.9 (85.8) |
29.8 (85.6) |
29.7 (85.5) |
29.7 (85.5) |
29.6 (85.3) |
29.2 (84.6) |
28.4 (83.1) |
28.6 (83.5) |
29.0 (84.2) |
29.4 (85.0) |
| Daily mean °C (°F) | 26.2 (79.2) |
26.5 (79.7) |
26.8 (80.2) |
26.7 (80.1) |
26.8 (80.2) |
26.4 (79.5) |
26.3 (79.3) |
26.3 (79.3) |
26.2 (79.2) |
26.0 (78.8) |
26.0 (78.8) |
26.1 (79.0) |
26.4 (79.4) |
| Mean daily minimum °C (°F) | 23.3 (73.9) |
23.2 (73.8) |
23.4 (74.1) |
23.6 (74.5) |
23.8 (74.8) |
23.1 (73.6) |
23.0 (73.4) |
23.1 (73.6) |
23.3 (73.9) |
23.7 (74.7) |
23.5 (74.3) |
23.2 (73.8) |
23.3 (74.0) |
| Average rainfall mm (inches) | 501.0 (19.72) |
403.1 (15.87) |
405.7 (15.97) |
552.4 (21.75) |
763.9 (30.07) |
639.4 (25.17) |
519.6 (20.46) |
526.9 (20.74) |
635.6 (25.02) |
750.6 (29.55) |
620.5 (24.43) |
546.8 (21.53) |
6,865.5 (270.28) |
| Average rainy days | 19 | 15 | 16 | 20 | 23 | 22 | 21 | 20 | 22 | 23 | 20 | 20 | 241 |
See also
 In Spanish: Timbiquí para niños
 | Selma Burke |
 | Pauline Powell Burns |
 | Frederick J. Brown |
 | Robert Blackburn |

