Unionville, Michigan facts for kids
Quick facts for kids
Unionville, Michigan
|
|
|---|---|
|
Village
|
|

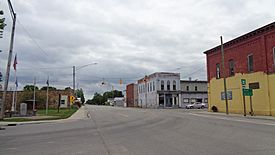
Intersection of M-25 and terminus of M-24
|
|

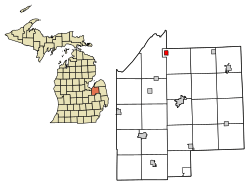
Location of Unionville, Michigan
|
|
| Country | United States |
| State | Michigan |
| County | Tuscola |
| Area | |
| • Total | 0.94 sq mi (2.43 km2) |
| • Land | 0.94 sq mi (2.43 km2) |
| • Water | 0.00 sq mi (0.00 km2) |
| Elevation | 620 ft (189 m) |
| Population
(2020)
|
|
| • Total | 481 |
| • Density | 512.25/sq mi (197.77/km2) |
| Time zone | UTC-5 (Eastern (EST)) |
| • Summer (DST) | UTC-4 (EDT) |
| ZIP code |
48767
|
| Area code(s) | 989 |
| FIPS code | 26-81420 |
| GNIS feature ID | 1615362 |
Unionville is a small village located in Tuscola County, in the U.S. state of Michigan. It is a part of the United States. In 2010, about 508 people lived there. By 2020, the population was 481. The village is found in the northwestern part of Columbia Township.
Contents
About Unionville's Location
Unionville is a small area of land. It covers about 0.94 square miles (2.43 square kilometers). All of this area is land, with no water.
The village is located in a part of Michigan known as "the Thumb". This area gets its name because it looks like a thumb on a map of Michigan. The Thumb region is also part of a larger area called the Flint/Tri-Cities.
People Living in Unionville
| Historical population | |||
|---|---|---|---|
| Census | Pop. | %± | |
| 1890 | 414 | — | |
| 1900 | 427 | 3.1% | |
| 1910 | 456 | 6.8% | |
| 1920 | 488 | 7.0% | |
| 1930 | 478 | −2.0% | |
| 1940 | 500 | 4.6% | |
| 1950 | 531 | 6.2% | |
| 1960 | 629 | 18.5% | |
| 1970 | 647 | 2.9% | |
| 1980 | 578 | −10.7% | |
| 1990 | 590 | 2.1% | |
| 2000 | 605 | 2.5% | |
| 2010 | 508 | −16.0% | |
| 2020 | 481 | −5.3% | |
| U.S. Decennial Census | |||
The number of people living in Unionville has changed over many years. This chart shows how the population has grown and shrunk since 1890.
Unionville's Population in 2010
In 2010, a special count called the census showed that 508 people lived in Unionville. These people lived in 218 different homes, and 154 of these were families.
Most of the people in Unionville were White (97.6%). A small number were Asian (0.2%) or from other backgrounds. About 3.0% of the population identified as Hispanic or Latino.
The village had 236 housing units. This means there were 236 places where people could live.
Households and Families
Out of the 218 homes:
- About 26.1% had children under 18 living there.
- Most homes (57.8%) were married couples living together.
- Some homes had a female head of the house without a husband (9.2%).
- A few had a male head of the house without a wife (3.7%).
- About 29.4% were not families, meaning individuals or groups of unrelated people.
Almost 27.1% of all homes had only one person living there. About 11.1% of homes had someone living alone who was 65 years old or older. On average, there were 2.33 people in each home and 2.81 people in each family.
Age of Residents
The average age of people in Unionville in 2010 was 43.6 years old.
- About 20.9% of residents were younger than 18.
- About 6.4% were between 18 and 24 years old.
- About 24.6% were between 25 and 44 years old.
- About 31% were between 45 and 64 years old.
- About 17.1% were 65 years old or older.
The village had a fairly even number of males and females. About 49.2% of the population was male, and 50.8% was female.
See also
 In Spanish: Unionville (Míchigan) para niños

