Vandans facts for kids
Quick facts for kids
Vandans
|
||
|---|---|---|
 |
||
|
||

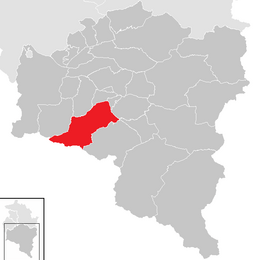
Location in the district
|
||
| Country | Austria | |
| State | Vorarlberg | |
| District | Bludenz | |
| Area | ||
| • Total | 53.44 km2 (20.63 sq mi) | |
| Elevation | 660 m (2,170 ft) | |
| Time zone | UTC+1 (CET) | |
| • Summer (DST) | UTC+2 (CEST) | |
| Postal code |
6773
|
|
| Area code | 05556 | |
| Vehicle registration | BZ | |
| Website | www.vandans.at | |
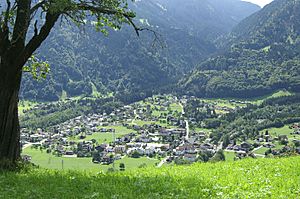
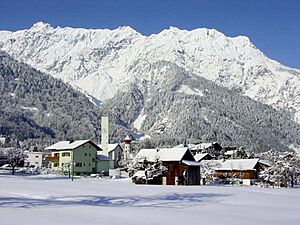
Vandans is a charming town located in the Bludenz district of Austria. It is part of the Vorarlberg state. The town sits high up, about 650 meters (2,133 feet) above sea level. Vandans is a popular spot for outdoor activities. People especially love it for skiing in winter and hiking during warmer months.
Contents
How Many People Live in Vandans?
Vandans has seen its population grow quite a bit over the years. In 1869, only 711 people lived there. By 2001, the number had grown to 2,638 residents. As of 2018, the population is around 2,605 people. This shows that more and more people have chosen to make Vandans their home.
| Historical population | ||
|---|---|---|
| Year | Pop. | ±% |
| 1869 | 711 | — |
| 1880 | 690 | −3.0% |
| 1890 | 625 | −9.4% |
| 1900 | 641 | +2.6% |
| 1910 | 652 | +1.7% |
| 1923 | 697 | +6.9% |
| 1934 | 874 | +25.4% |
| 1939 | 825 | −5.6% |
| 1951 | 1,169 | +41.7% |
| 1961 | 1,546 | +32.2% |
| 1971 | 1,828 | +18.2% |
| 1981 | 2,033 | +11.2% |
| 1991 | 2,311 | +13.7% |
| 2001 | 2,638 | +14.1% |
| 2011 | 2,605 | −1.3% |
What is the Weather Like in Vandans?
Vandans experiences a range of temperatures throughout the year. Summers are generally warm, while winters are cold and snowy. The town gets a good amount of rain, especially in the summer months.
Temperatures in Vandans
The warmest month is usually July, with average temperatures around 17.2°C (63°F). The coldest month is January, with an average of -1.1°C (30°F). The highest temperature ever recorded was 36.3°C (97.3°F) in August. The lowest was a chilly -23.9°C (-11.0°F) in January.
Rainfall and Sunshine
Vandans receives about 1,430 mm (56 inches) of rain each year. The wettest months are July and August. Even with the rain, Vandans gets a fair amount of sunshine. July is the sunniest month, with about 209 hours of sun. December is the least sunny, with only 29 hours.
| Climate data for Vandans (1981–2010) | |||||||||||||
|---|---|---|---|---|---|---|---|---|---|---|---|---|---|
| Month | Jan | Feb | Mar | Apr | May | Jun | Jul | Aug | Sep | Oct | Nov | Dec | Year |
| Record high °C (°F) | 16.5 (61.7) |
19.7 (67.5) |
23.6 (74.5) |
26.2 (79.2) |
30.8 (87.4) |
33.4 (92.1) |
35.4 (95.7) |
36.3 (97.3) |
29.1 (84.4) |
27.1 (80.8) |
23.8 (74.8) |
19.7 (67.5) |
36.3 (97.3) |
| Mean daily maximum °C (°F) | 3.1 (37.6) |
4.9 (40.8) |
9.8 (49.6) |
14.3 (57.7) |
19.2 (66.6) |
21.6 (70.9) |
23.6 (74.5) |
22.9 (73.2) |
18.9 (66.0) |
14.7 (58.5) |
7.5 (45.5) |
3.4 (38.1) |
13.7 (56.7) |
| Daily mean °C (°F) | −1.1 (30.0) |
−0.2 (31.6) |
3.7 (38.7) |
7.9 (46.2) |
12.7 (54.9) |
15.3 (59.5) |
17.2 (63.0) |
16.5 (61.7) |
12.8 (55.0) |
8.7 (47.7) |
3.0 (37.4) |
−0.3 (31.5) |
8.0 (46.4) |
| Mean daily minimum °C (°F) | −4.1 (24.6) |
−3.5 (25.7) |
−0.1 (31.8) |
3.1 (37.6) |
7.3 (45.1) |
10.1 (50.2) |
12.1 (53.8) |
11.9 (53.4) |
8.8 (47.8) |
5.1 (41.2) |
0.1 (32.2) |
−3.0 (26.6) |
4.0 (39.2) |
| Record low °C (°F) | −23.9 (−11.0) |
−18.2 (−0.8) |
−16.7 (1.9) |
−7.3 (18.9) |
−2.0 (28.4) |
0.5 (32.9) |
4.2 (39.6) |
3.5 (38.3) |
−0.7 (30.7) |
−7.9 (17.8) |
−13.1 (8.4) |
−14.9 (5.2) |
−23.9 (−11.0) |
| Average precipitation mm (inches) | 96 (3.8) |
88 (3.5) |
105 (4.1) |
93 (3.7) |
116 (4.6) |
156 (6.1) |
173 (6.8) |
171 (6.7) |
129 (5.1) |
89 (3.5) |
104 (4.1) |
109 (4.3) |
1,430 (56.3) |
| Average relative humidity (%) (at 14:00) | 73.8 | 65.0 | 56.0 | 50.5 | 52.4 | 56.4 | 57.6 | 60.4 | 64.0 | 66.3 | 74.2 | 77.8 | 62.9 |
| Mean monthly sunshine hours | 44 | 82 | 132 | 157 | 183 | 180 | 209 | 196 | 162 | 119 | 55 | 29 | 1,548 |
| Percent possible sunshine | 48.3 | 53.0 | 47.4 | 47.9 | 49.9 | 49.4 | 55.9 | 55.6 | 53.8 | 56.4 | 44.1 | 45.1 | 50.6 |
| Source: Central Institute for Meteorology and Geodynamics | |||||||||||||
| Climate data for Vandans (1971–2000) | |||||||||||||
|---|---|---|---|---|---|---|---|---|---|---|---|---|---|
| Month | Jan | Feb | Mar | Apr | May | Jun | Jul | Aug | Sep | Oct | Nov | Dec | Year |
| Record high °C (°F) | 16.5 (61.7) |
19.7 (67.5) |
23.6 (74.5) |
25.6 (78.1) |
30.1 (86.2) |
32.2 (90.0) |
35.4 (95.7) |
33.0 (91.4) |
29.1 (84.4) |
27.1 (80.8) |
23.8 (74.8) |
19.7 (67.5) |
35.4 (95.7) |
| Mean daily maximum °C (°F) | 2.8 (37.0) |
4.7 (40.5) |
9.5 (49.1) |
13.6 (56.5) |
18.6 (65.5) |
20.7 (69.3) |
23.0 (73.4) |
22.7 (72.9) |
18.9 (66.0) |
14.4 (57.9) |
7.3 (45.1) |
3.6 (38.5) |
13.3 (55.9) |
| Daily mean °C (°F) | −1.4 (29.5) |
−0.3 (31.5) |
3.6 (38.5) |
7.3 (45.1) |
12.1 (53.8) |
14.6 (58.3) |
16.7 (62.1) |
16.3 (61.3) |
12.7 (54.9) |
8.5 (47.3) |
2.7 (36.9) |
−0.1 (31.8) |
7.7 (45.9) |
| Mean daily minimum °C (°F) | −4.5 (23.9) |
−3.7 (25.3) |
−0.2 (31.6) |
2.7 (36.9) |
6.8 (44.2) |
9.6 (49.3) |
11.8 (53.2) |
11.7 (53.1) |
8.6 (47.5) |
4.9 (40.8) |
−0.3 (31.5) |
−3.0 (26.6) |
3.7 (38.7) |
| Record low °C (°F) | −23.9 (−11.0) |
−18.2 (−0.8) |
−12.3 (9.9) |
−5.3 (22.5) |
−3.5 (25.7) |
0.5 (32.9) |
4.2 (39.6) |
3.5 (38.3) |
−0.7 (30.7) |
−6.7 (19.9) |
−15.4 (4.3) |
−14.8 (5.4) |
−23.9 (−11.0) |
| Average precipitation mm (inches) | 97.0 (3.82) |
89.1 (3.51) |
109.7 (4.32) |
96.7 (3.81) |
116.4 (4.58) |
162.8 (6.41) |
181.1 (7.13) |
164.6 (6.48) |
129.8 (5.11) |
87.8 (3.46) |
99.8 (3.93) |
112.8 (4.44) |
1,447.6 (56.99) |
| Average snowfall cm (inches) | 55.9 (22.0) |
53.4 (21.0) |
39.7 (15.6) |
11.1 (4.4) |
1.2 (0.5) |
0.0 (0.0) |
0.0 (0.0) |
0.0 (0.0) |
0.4 (0.2) |
0.1 (0.0) |
22.6 (8.9) |
47.9 (18.9) |
232.3 (91.5) |
| Average precipitation days (≥ 1.0 mm) | 11.3 | 10.0 | 13.0 | 11.8 | 13.5 | 15.6 | 15.0 | 13.9 | 11.6 | 9.9 | 10.8 | 11.8 | 148.2 |
| Average relative humidity (%) (at 14:00) | 73.3 | 64.6 | 55.9 | 49.9 | 51.7 | 56.3 | 56.9 | 58.9 | 62.3 | 65.0 | 72.7 | 77.0 | 62.0 |
| Mean monthly sunshine hours | 42.6 | 82.0 | 126.6 | 150.2 | 180.7 | 159.7 | 199.5 | 192.0 | 164.6 | 116.4 | 55.2 | 28.9 | 1,498.4 |
| Percent possible sunshine | 50.0 | 51.8 | 45.5 | 45.8 | 48.5 | 44.2 | 54.2 | 54.5 | 54.1 | 54.0 | 44.8 | 46.1 | 49.5 |
| Source: Central Institute for Meteorology and Geodynamics | |||||||||||||
Getting Around Vandans: Transport
Vandans has its own Vandans railway station. This station is part of the Bludenz–Schruns railway line. The S4 regional train service stops here. This train service is part of the Vorarlberg S-Bahn system. It is operated by a company called Montafonerbahn (MBS). This makes it easy for people to travel to and from Vandans by train.
See also
 In Spanish: Vandans para niños
 | John T. Biggers |
 | Thomas Blackshear |
 | Mark Bradford |
 | Beverly Buchanan |


