Venetian Village, Illinois facts for kids
Quick facts for kids
Venetian Village, Illinois
|
|
|---|---|
| Country | |
| State | |
| County | |
| Township | Lake Villa |
| Area | |
| • Total | 2.38 sq mi (6.17 km2) |
| • Land | 1.77 sq mi (4.59 km2) |
| • Water | 0.61 sq mi (1.58 km2) |
| Population
(2020)
|
|
| • Total | 2,761 |
| • Density | 1,556.37/sq mi (601.00/km2) |
| Time zone | UTC-6 (CST) |
| • Summer (DST) | UTC-5 (CDT) |
| FIPS code | 17-77460 |
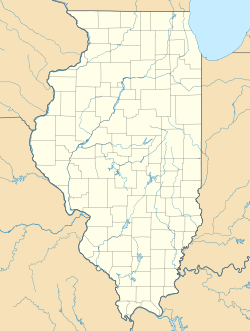
Venetian Village is a special kind of community called a census-designated place (CDP). It is located in Lake County, Illinois, in the United States. In 2020, about 2,761 people lived there.
Where is Venetian Village Located?
Venetian Village is in the northwest part of Lake County. It is part of Lake Villa Township. The community is built around four lakes: Sand Lake, Slough Lake, Miltmore Lake, and Fourth Lake. The main Venetian Village area is in the east, and another neighborhood called West Miltmore is in the west.
Two main roads are close to Venetian Village. Illinois Route 83 runs along its western side. This road goes north about 1 mile to Lake Villa and south about 4 miles to Grayslake. Illinois Route 132 is on the northern edge of Venetian Village. It goes west into Lake Villa and southeast about 8 miles to Gurnee.
The total area of Venetian Village is about 6.1 square kilometers (2.38 square miles). Most of this area, about 4.5 square kilometers (1.77 square miles), is land. The rest, about 1.6 square kilometers (0.61 square miles), is water, making up about 25.84% of the total area.
Who Lives in Venetian Village?
| Historical population | |||
|---|---|---|---|
| Census | Pop. | %± | |
| 2000 | 3,082 | — | |
| 2010 | 2,826 | −8.3% | |
| 2020 | 2,761 | −2.3% | |
| U.S. Decennial Census 2010 2020 |
|||
The United States Census Bureau collects information about the people living in places like Venetian Village every ten years. In 2020, the population was 2,761 people.
Most people in Venetian Village are White. In 2020, about 77% of the residents were White. Other groups living in the community include Black or African American people (about 1.88%), Asian people (about 1.12%), and Native American people (about 0.07%). About 3.88% of people reported being of two or more races.
People who identify as Hispanic or Latino can be of any race. In Venetian Village, about 15.68% of the population was Hispanic or Latino in 2020. This shows that Venetian Village is a community with a mix of different backgrounds.
See also
 In Spanish: Venetian Village para niños


