Wapella, Illinois facts for kids
Quick facts for kids
Wapella
|
||
|---|---|---|
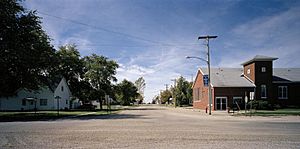
Main Street
|
||
|
||
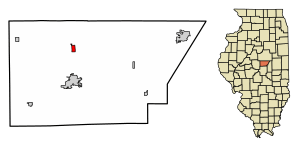
Location of Wapella in DeWitt County, Illinois.
|
||
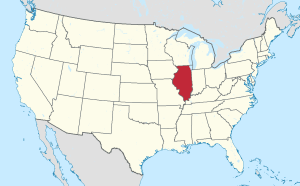
Location of Illinois in the United States
|
||
| Country | United States | |
| State | Illinois | |
| County | DeWitt | |
| Area | ||
| • Total | 0.55 sq mi (1.43 km2) | |
| • Land | 0.55 sq mi (1.43 km2) | |
| • Water | 0.00 sq mi (0.00 km2) | |
| Elevation | 745 ft (227 m) | |
| Population
(2020)
|
||
| • Total | 513 | |
| • Density | 931.03/sq mi (359.71/km2) | |
| Time zone | UTC-6 (CST) | |
| • Summer (DST) | UTC-5 (CDT) | |
| ZIP Code(s) |
61777
|
|
| Area code(s) | 217 | |
| FIPS code | 17-78773 | |
| GNIS feature ID | 2400092 | |
| Wikimedia Commons | Wapella, Illinois | |
Wapella is a small village located in DeWitt County, Illinois, in the United States. In 2020, about 513 people lived there.
Contents
History of Wapella
Wapella was officially started in 1854. However, people began settling in the area much earlier, around 1829. They were drawn to the rich soil and thick forests.
How Wapella Got Its Name
The village is named after Chief Wapello. He was an important leader of the Meskwaki people.
Early Settlers
The first European settlers came from Kentucky. Soon after, many Irish immigrants moved to Wapella. They came to help build and work on the Illinois Central Railroad. This railroad was very important for connecting different parts of the country.
Village Growth
David Augustus Neal helped plan out the village. He was a vice president and surveyor for the Illinois Central Railroad. By the time the American Civil War began, Wapella had grown to about 500 residents.
Geography of Wapella
Wapella is located entirely on land. It covers an area of about 0.55 square miles (1.43 square kilometers).
Population and People
The population of Wapella has changed over the years. Here's a quick look at how many people have lived there:
| Historical population | |||
|---|---|---|---|
| Census | Pop. | %± | |
| 1880 | 369 | — | |
| 1890 | 371 | 0.5% | |
| 1900 | 442 | 19.1% | |
| 1910 | 498 | 12.7% | |
| 1920 | 528 | 6.0% | |
| 1930 | 521 | −1.3% | |
| 1940 | 496 | −4.8% | |
| 1950 | 504 | 1.6% | |
| 1960 | 526 | 4.4% | |
| 1970 | 572 | 8.7% | |
| 1980 | 768 | 34.3% | |
| 1990 | 608 | −20.8% | |
| 2000 | 651 | 7.1% | |
| 2010 | 558 | −14.3% | |
| 2020 | 513 | −8.1% | |
| U.S. Decennial Census | |||
Who Lives in Wapella?
In 2020, there were 513 people living in Wapella. There were 210 households and 127 families. Most people in the village are White. A small number of people are from other racial backgrounds. About 1.75% of the population identified as Hispanic or Latino.
Households and Families
- About 26.2% of households had children under 18 living with them.
- Many households (43.33%) were married couples living together.
- Some households (8.57%) had a female head without a husband.
- About 35.24% of all households were made up of people living alone.
- About 19.05% of households had someone 65 years or older living alone.
- The average household had 2.71 people.
- The average family had 2.26 people.
Age Groups
The people in Wapella are of different ages:
- 18.4% were under 18 years old.
- 9.3% were between 18 and 24.
- 27.6% were between 25 and 44.
- 24.5% were between 45 and 64.
- 20.3% were 65 years or older.
The average age in Wapella was 43.6 years. For every 100 females, there were about 86.6 males.
See also
 In Spanish: Wapella (Illinois) para niños
 | Delilah Pierce |
 | Gordon Parks |
 | Augusta Savage |
 | Charles Ethan Porter |


