Webster (CDP), Massachusetts facts for kids
Quick facts for kids
Webster, Massachusetts
|
|
|---|---|

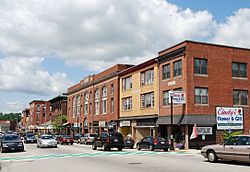
Downtown Webster
|
|

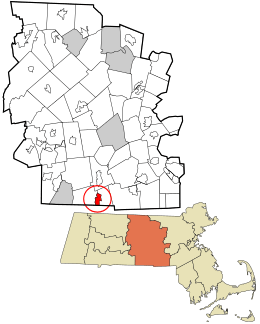
Location in Worcester County and the state of Massachusetts.
|
|
| Country | United States |
| State | Massachusetts |
| County | Worcester |
| Area | |
| • Total | 3.03 sq mi (7.84 km2) |
| • Land | 2.97 sq mi (7.69 km2) |
| • Water | 0.06 sq mi (0.14 km2) |
| Elevation | 463 ft (141 m) |
| Population
(2020)
|
|
| • Total | 12,194 |
| • Density | 4,104.34/sq mi (1,584.82/km2) |
| Time zone | UTC-5 (Eastern (EST)) |
| • Summer (DST) | UTC-4 (EDT) |
| ZIP code |
01570
|
| Area code(s) | 508 |
| FIPS code | 25-73930 |
| GNIS feature ID | 0610298 |
Webster is a special kind of community called a census-designated place (CDP). It is located in the town of Webster within Worcester County, Massachusetts, in the United States. In 2020, about 12,194 people lived here.
Contents
Where is Webster Located?
Webster is found in the state of Massachusetts. Its exact location is 42.048981 degrees north and 71.875602 degrees west.
Land and Water Area
The total area of Webster is about 7.7 square kilometers (3.0 square miles). Most of this area, about 7.5 square kilometers (2.9 square miles), is land. The rest, about 0.2 square kilometers (0.1 square miles), is water.
Who Lives in Webster?
| Historical population | |||
|---|---|---|---|
| Census | Pop. | %± | |
| 2020 | 12,194 | — | |
| U.S. Decennial Census | |||
In the year 2000, there were 11,600 people living in Webster. These people lived in 5,024 households. A household means all the people who live together in one home.
Population Details
Most people in Webster were White (93.67%). Other groups included Black or African American (1.34%), Native American (0.40%), and Asian (1.09%). About 5.07% of the population was Hispanic or Latino.
Many households (27.3%) had children under 18 living with them. About 38.3% of households were married couples. Some households (13.7%) had a female head with no husband present.
Age Groups
The population in Webster was spread out across different age groups.
- 23.4% of people were under 18 years old.
- 8.0% were between 18 and 24 years old.
- 30.6% were between 25 and 44 years old.
- 19.5% were between 45 and 64 years old.
- 18.5% were 65 years old or older.
The average age of people in Webster was 37 years. For every 100 females, there were about 89 males.
See also
 In Spanish: Webster (condado de Worcester) para niños
 | Selma Burke |
 | Pauline Powell Burns |
 | Frederick J. Brown |
 | Robert Blackburn |

