West Millgrove, Ohio facts for kids
Quick facts for kids
West Millgrove, Ohio
|
|
|---|---|
|
Village
|
|
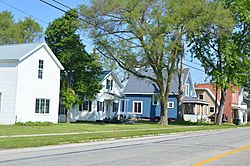
Houses on State Route 199
|
|
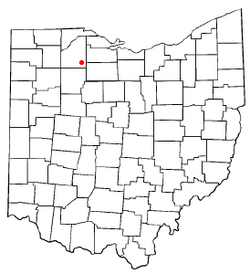
Location of West Millgrove, Ohio
|
|
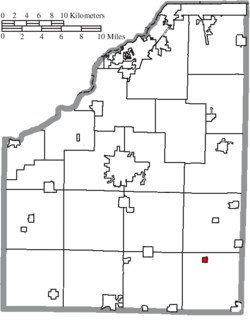
Location of West Millgrove in Wood County
|
|
| Country | United States |
| State | Ohio |
| County | Wood |
| Township | Perry |
| Area | |
| • Total | 0.26 sq mi (0.67 km2) |
| • Land | 0.26 sq mi (0.67 km2) |
| • Water | 0.00 sq mi (0.00 km2) |
| Elevation | 712 ft (217 m) |
| Population
(2020)
|
|
| • Total | 131 |
| • Density | 503.85/sq mi (194.55/km2) |
| Time zone | UTC-5 (Eastern (EST)) |
| • Summer (DST) | UTC-4 (EDT) |
| ZIP code |
43467
|
| Area code(s) | 419 |
| FIPS code | 39-83888 |
| GNIS feature ID | 2400139 |
West Millgrove is a small village located in Wood County, Ohio, United States. In 2020, about 131 people lived there. It's a quiet place in the state of Ohio.
Contents
History of West Millgrove
West Millgrove was first known as Millgrove. It was officially planned out in 1835. A post office opened there in 1837, and it was called West Mill Grove.
Later, in 1895, the spelling of the name was changed to West Millgrove. The village became an official town in 1874. This means it got its own local government.
Where is West Millgrove?
West Millgrove is located in Ohio. The United States Census Bureau says the village covers a total area of about 0.26 square miles (0.67 square kilometers). All of this area is land. There are no large lakes or rivers within the village limits.
Who Lives in West Millgrove?
This section tells us about the people who live in West Millgrove. It looks at how many people live there and some details about them.
Population Changes Over Time
The number of people living in West Millgrove has changed a lot over the years. Here's a quick look at its population from 1880 to 2020:
| Historical population | |||
|---|---|---|---|
| Census | Pop. | %± | |
| 1880 | 222 | — | |
| 1890 | 207 | −6.8% | |
| 1900 | 236 | 14.0% | |
| 1910 | 191 | −19.1% | |
| 1920 | 132 | −30.9% | |
| 1930 | 158 | 19.7% | |
| 1940 | 197 | 24.7% | |
| 1950 | 180 | −8.6% | |
| 1960 | 196 | 8.9% | |
| 1970 | 215 | 9.7% | |
| 1980 | 205 | −4.7% | |
| 1990 | 171 | −16.6% | |
| 2000 | 78 | −54.4% | |
| 2010 | 174 | 123.1% | |
| 2020 | 131 | −24.7% | |
| U.S. Decennial Census | |||
As you can see, the population has gone up and down. It was highest in 1900 with 236 people. The lowest was in 2000 with only 78 people.
A Look at the People in 2010
In 2010, there were 174 people living in West Millgrove. These people lived in 64 different homes, called households. Out of these, 43 were families.
The village had about 669 people per square mile. This is called the population density. There were also 70 housing units, which are places where people can live.
Most people in the village were White (96.0%). A small number were from other backgrounds. About 1.7% of the people were Hispanic or Latino.
- Many homes (37.5%) had children under 18 living there.
- About 35.9% of homes were married couples living together.
- Some homes (23.4%) had a female head of the house without a husband.
- About 7.8% had a male head of the house without a wife.
- About 32.8% of households were not families.
The average number of people in a household was 2.72. For families, the average was 3.37 people.
The average age of people in the village was 32 years old.
- About 31% of residents were under 18.
- About 9.2% were between 18 and 24.
- About 25.3% were between 25 and 44.
- About 24.6% were between 45 and 64.
- About 9.8% were 65 years old or older.
More females lived in the village than males. About 56.3% of the population was female, and 43.7% was male.
See also
 In Spanish: West Millgrove (Ohio) para niños
 | Percy Lavon Julian |
 | Katherine Johnson |
 | George Washington Carver |
 | Annie Easley |

