Älvkarleby Municipality facts for kids
Quick facts for kids
Älvkarleby Municipality
Älvkarleby kommun
|
||
|---|---|---|
 |
||
|
||
 |
||
| Country | Sweden | |
| County | Uppsala County | |
| Seat | Skutskär | |
| Area | ||
| • Total | 615.7747 km2 (237.7519 sq mi) | |
| • Land | 213.3847 km2 (82.3883 sq mi) | |
| • Water | 402.39 km2 (155.36 sq mi) | |
| Area as of January 1, 2010. | ||
| Population
(June 30, 2012)
|
||
| • Total | 9,060 | |
| • Density | 14.713/km2 (38.107/sq mi) | |
| Time zone | UTC+1 (CET) | |
| • Summer (DST) | UTC+2 (CEST) | |
| ISO 3166 code | SE | |
| Province | Uppland | |
| Municipal code | 0319 | |
| Website | www.alvkarleby.se | |
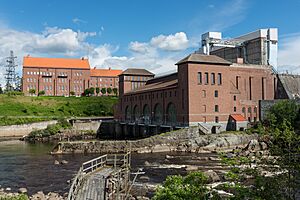
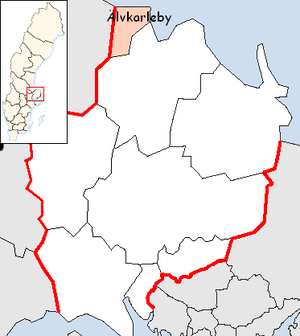
Älvkarleby Municipality (which in Swedish is Älvkarleby kommun) is a special area in Sweden. It's like a local government district. You can find it in the eastern part of central Sweden, in a place called Uppsala County. The main town where the local government offices are located is Skutskär.
This municipality is quite unique! It's one of the very few in Sweden that hasn't changed its borders since it was first created. This happened way back in 1863, when Sweden started setting up its first local government rules.
Contents
Towns and Villages in Älvkarleby
Älvkarleby Municipality is home to several smaller towns and villages. These are the main ones:
- Gårdskär
- Marma
- Skutskär (This is the main town, also called the seat)
- Älvkarleby
A Look Back at History
The land that is now Älvkarleby Municipality started to appear from the Baltic Sea a very long time ago. This was during the late Bronze Age, around 1000 BC. People have found signs that settlements existed here even then.
Later, in the early Iron Age (from about 600 AD to 1200 AD), more people began to live in the area. They made a living by farming, hunting, fishing, and raising animals. The first time Älvkarleby was written about in official papers was in the early Middle Ages, around the 1200s.
A famous writer named Stig Dagerman was also from Älvkarleby.
Who Lives in Älvkarleby?
In 2022, there were about 9,614 people living in Älvkarleby Municipality. Out of these, about 7,312 were Swedish citizens old enough to vote.
When people voted in the 2022 Swedish general election, about 46.4% of the votes went to parties on the "left side" of politics. About 52.2% of the votes went to parties on the "right side." This was a big change from earlier elections, where the Social Democrats (a left-leaning party) usually got most of the votes.
How People Vote in Älvkarleby
Älvkarleby has a history of often voting for the Social Democrats. This party usually won by a lot. However, in recent elections, like in 2010 and 2014, the Social Democrats didn't quite reach 50% of the votes in the municipality.
When we look at the results for the Swedish Parliament (called the Riksdag), we can see how the votes have changed over time. For example, in 1973, the Social Democrats got over 70% of the votes. By 2014, their share had dropped to around 47%. Meanwhile, the Sweden Democrats party, which didn't get many votes in earlier elections, grew to almost 20% by 2014.
This shows how the political landscape in Älvkarleby, like in many places, can change over the years.
See also
 In Spanish: Municipio de Älvkarleby para niños
 | Mary Eliza Mahoney |
 | Susie King Taylor |
 | Ida Gray |
 | Eliza Ann Grier |


