1980 Canadian federal election facts for kids
|
|||||||||||||||||||||||||||||||||||||||||||||||||||||||||||||||||||||||||||||
|
|
|||||||||||||||||||||||||||||||||||||||||||||||||||||||||||||||||||||||||||||
|
282 seats in the House of Commons 142 seats needed for a majority |
|||||||||||||||||||||||||||||||||||||||||||||||||||||||||||||||||||||||||||||
|---|---|---|---|---|---|---|---|---|---|---|---|---|---|---|---|---|---|---|---|---|---|---|---|---|---|---|---|---|---|---|---|---|---|---|---|---|---|---|---|---|---|---|---|---|---|---|---|---|---|---|---|---|---|---|---|---|---|---|---|---|---|---|---|---|---|---|---|---|---|---|---|---|---|---|---|---|---|
| Turnout | 69.3% ( |
||||||||||||||||||||||||||||||||||||||||||||||||||||||||||||||||||||||||||||
|
|||||||||||||||||||||||||||||||||||||||||||||||||||||||||||||||||||||||||||||
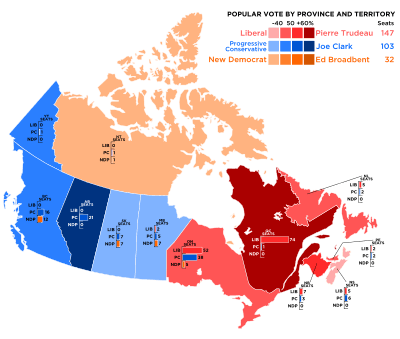
Popular vote by province, with graphs indicating the number of seats won. As this is an FPTP election, seat totals are not determined by popular vote by province but instead via results by each riding.
|
|||||||||||||||||||||||||||||||||||||||||||||||||||||||||||||||||||||||||||||
|
|||||||||||||||||||||||||||||||||||||||||||||||||||||||||||||||||||||||||||||
The 1980 Canadian federal election was an important vote held on February 18, 1980. Canadians went to the polls to choose members for the House of Commons of Canada, which is part of the country's Parliament. This election decided who would form the next government.
Election Overview
This election happened only nine months after the previous one in 1979. The Progressive Conservative Party, led by Joe Clark, had won the most seats in 1979. However, they had a minority government, meaning they didn't have enough seats to pass laws easily.
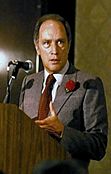
In December 1979, the Progressive Conservative government lost a vote in the House of Commons. This meant they had to call a new election. This gave the Liberal Party, led by former Prime Minister Pierre Trudeau, a chance to win back power.
Key Results
The Liberal Party, led by Pierre Trudeau, won a clear majority of seats. They secured 147 seats out of 282. This meant they had more than half the seats, allowing them to form a strong government.
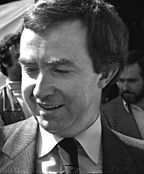
The Progressive Conservative Party, led by Joe Clark, lost many seats. They went from 136 seats down to 103. This was a big change from the previous election.
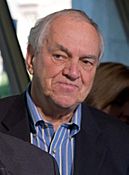
The New Democratic Party (NDP), led by Ed Broadbent, gained a few more seats. They increased their total from 26 to 32.
The Social Credit Party lost all their seats in this election. Their leader, Fabien Roy, also lost his seat.
| ↓ | ||||
| 147 | 103 | 32 | ||
| Liberal | Progressive Conservative | NDP | ||
How Canadians Voted
About 69.3% of eligible voters cast their ballots in this election. This was a bit lower than the previous election.
Here's a look at how the main parties did in terms of total votes:
| Popular vote | ||||
|---|---|---|---|---|
| Liberal | 44.34% | |||
| PC | 32.45% | |||
| NDP | 19.77% | |||
| Social Credit | 1.70% | |||
| Others | 1.74% | |||
| Seat totals | ||||
|---|---|---|---|---|
| Liberal | 52.13% | |||
| PC | 36.52% | |||
| NDP | 11.35% | |||
Changes in Parliament
Before this election, there were a few changes in the House of Commons:
- A Member of Parliament (MP) from the Social Credit Party, Richard Janelle, decided to join the Progressive Conservative Party.
- A well-known Progressive Conservative MP, John Diefenbaker, passed away. A special election was held to fill his seat, and a New Democrat candidate won.
See also
 In Spanish: Elecciones federales de Canadá de 1980 para niños
 | Jessica Watkins |
 | Robert Henry Lawrence Jr. |
 | Mae Jemison |
 | Sian Proctor |
 | Guion Bluford |


