
1984 Canadian federal election facts for kids
|
|||||||||||||||||||||||||||||||||||||||||||||||||
|
|
|||||||||||||||||||||||||||||||||||||||||||||||||
|
282 seats in the House of Commons 142 seats needed for a majority |
|||||||||||||||||||||||||||||||||||||||||||||||||
|---|---|---|---|---|---|---|---|---|---|---|---|---|---|---|---|---|---|---|---|---|---|---|---|---|---|---|---|---|---|---|---|---|---|---|---|---|---|---|---|---|---|---|---|---|---|---|---|---|---|
| Turnout | 75.3% ( |
||||||||||||||||||||||||||||||||||||||||||||||||
|
|||||||||||||||||||||||||||||||||||||||||||||||||

Popular vote by province, with graphs indicating the number of seats won. As this is an FPTP election, seat totals are not determined by popular vote by province but instead via results by each riding.
|
|||||||||||||||||||||||||||||||||||||||||||||||||
|
|||||||||||||||||||||||||||||||||||||||||||||||||


The 1984 Canadian federal election was a big event in Canada's history. It happened on September 4, 1984. During this election, Canadians voted for people to represent them in the House of Commons. This group of elected people forms the 33rd Parliament of Canada.
The main goal of a federal election is to choose which political party will form the government. The leader of the winning party usually becomes the Prime Minister.
Contents
What is a Federal Election?
A federal election is when people across Canada vote for their chosen representatives. These representatives are called Members of Parliament (MPs). Each MP represents a specific area, known as a "riding" or "electoral district."
The party that wins the most seats in the House of Commons usually forms the government. The House of Commons is where new laws are discussed and made for the whole country.
The 1984 Canadian Election
The 1984 election was important because it led to a big change in Canada's government. The election decided who would lead the country for the next few years.
Who Were the Main Parties and Leaders?
There were three main political parties in Canada during the 1984 election:
- The Progressive Conservative Party (PC) was led by Brian Mulroney.
- The Liberal Party was led by John Turner.
- The New Democratic Party (NDP) was led by Ed Broadbent.
These leaders and their parties campaigned across the country, asking Canadians for their votes.
What Happened in the Election?
The 1984 election saw a major shift in power. The Progressive Conservative Party won a large number of seats. This meant they would form the new government.
How Many Seats Did Each Party Win?
In this election, there were 282 seats available in the House of Commons. To form a majority government, a party needed to win at least 142 seats.
Here's how the seats were divided after the election:
| ↓ | ||||
| 211 | 40 | 30 | 1 | |
| Progressive Conservative | Liberal | NDP | O | |
- The Progressive Conservative Party won 211 seats. This was a huge increase for them.
- The Liberal Party won 40 seats. This was a big decrease from the previous election.
- The New Democratic Party won 30 seats.
- One seat was won by a candidate with no party affiliation.
What Was the Popular Vote?
The "popular vote" means the total number of votes each party received from all voters.
| Popular vote | ||||
|---|---|---|---|---|
| PC | 50.03% | |||
| Liberal | 28.02% | |||
| NDP | 18.81% | |||
| Others | 3.14% | |||
- The Progressive Conservative Party received about 50% of all votes.
- The Liberal Party received about 28% of all votes.
- The New Democratic Party received about 18.8% of all votes.
This election marked a significant victory for the Progressive Conservatives. Brian Mulroney became the new Prime Minister of Canada.
Images for kids
-
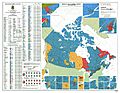
Map of Canada, showing the results of the 1984 election by riding.

See also
 In Spanish: Elecciones federales de Canadá de 1984 para niños
