
1988 Canadian federal election facts for kids
|
|||||||||||||||||||||||||||||||||||||||||||||||||
|
|
|||||||||||||||||||||||||||||||||||||||||||||||||
|
295 seats in the House of Commons 148 seats needed for a majority |
|||||||||||||||||||||||||||||||||||||||||||||||||
|---|---|---|---|---|---|---|---|---|---|---|---|---|---|---|---|---|---|---|---|---|---|---|---|---|---|---|---|---|---|---|---|---|---|---|---|---|---|---|---|---|---|---|---|---|---|---|---|---|---|
| Turnout | 75.3% | ||||||||||||||||||||||||||||||||||||||||||||||||
|
|||||||||||||||||||||||||||||||||||||||||||||||||

Popular vote by province, with graphs indicating the number of seats won. As this is an FPTP election, seat totals are not determined by popular vote by province but instead via results by each riding.
|
|||||||||||||||||||||||||||||||||||||||||||||||||
|
|||||||||||||||||||||||||||||||||||||||||||||||||
.jpg)


The 1988 Canadian federal election was an important event in Canada's history. It took place on November 21, 1988. During this election, Canadians voted for people to represent them in the House of Commons of Canada. These elected members then formed the 34th Parliament. Federal elections decide which political party will lead the country.
Contents
What Happened in the 1988 Election?
This election was a big moment for Canadian politics. People across the country voted for their preferred candidates. The main goal was to choose the next government.
Who Won the Election?
The Progressive Conservative Party, led by Brian Mulroney, won the election. They secured 169 seats in the House of Commons. This meant they had enough seats to form a majority government. A majority government means one party has more than half of all the seats.
How Did Other Parties Do?
The Liberal Party, led by John Turner, came in second place. They won 83 seats. The New Democratic Party (NDP), led by Ed Broadbent, finished third with 43 seats.
Understanding the Votes and Seats
In an election, people vote for a candidate in their local area, called a riding. The candidate who gets the most votes in that riding wins the seat. This is called the "first-past-the-post" system. The total number of votes a party gets across the country is called the "popular vote."
| Popular Vote in 1988 | ||||
|---|---|---|---|---|
| PC | 43.02% | |||
| Liberal | 31.92% | |||
| NDP | 20.38% | |||
| Reform | 2.09% | |||
| Others | 2.59% | |||
| Seats Won in 1988 | ||||
|---|---|---|---|---|
| PC | 57.29% | |||
| Liberal | 28.14% | |||
| NDP | 14.58% | |||
| ↓ | ||||
| 169 | 83 | 43 | ||
| Progressive Conservative | Liberal | NDP | ||
Results Across Canada's Provinces
The election results varied from province to province. Each province and territory elected a certain number of Members of Parliament (MPs). Here's a look at how the main parties performed in different parts of Canada.
| Party name | BC | AB | SK | MB | ON | QC | NB | NS | PE | NL | NT | YK | Total | ||
|---|---|---|---|---|---|---|---|---|---|---|---|---|---|---|---|
| Progressive Conservative | Seats: | 12 | 25 | 4 | 7 | 46 | 63 | 5 | 5 | - | 2 | - | - | 169 | |
| Popular Vote: | 35.3 | 51.8 | 36.4 | 36.9 | 38.2 | 52.7 | 40.4 | 40.9 | 41.5 | 42.2 | 26.4 | 35.3 | 43.0 | ||
| Liberal | Seats: | 1 | - | - | 5 | 43 | 12 | 5 | 6 | 4 | 5 | 2 | - | 83 | |
| Vote: | 20.4 | 13.7 | 18.2 | 36.5 | 38.9 | 30.3 | 45.4 | 46.5 | 49.9 | 45.0 | 41.4 | 11.3 | 31.9 | ||
| New Democratic Party | Seats: | 19 | 1 | 10 | 2 | 10 | - | - | - | - | - | - | 1 | 43 | |
| Vote: | 37.0 | 17.4 | 44.2 | 21.3 | 20.1 | 14.4 | 9.3 | 11.4 | 7.5 | 12.4 | 28.3 | 51.4 | 20.38 | ||
| Total seats | 32 | 26 | 14 | 14 | 99 | 75 | 10 | 11 | 4 | 7 | 2 | 1 | 295 | ||
| Parties that won no seats: | |||||||||||||||
| Reform | Vote: | 4.8 | 15.4 | 3.3 | 2.1 | ||||||||||
| Christian Heritage | Vote: | 1.1 | 1.4 | 2.0 | 0.8 | ||||||||||
| Rhinoceros | Vote: | 1.2 | 0.4 | ||||||||||||
| Green | Vote: | 0.4 | |||||||||||||
| Confederation of Regions | Vote: | 4.3 | 0.3 | ||||||||||||
| Libertarian | Vote: | 0.3 | |||||||||||||
| Commonwealth of Canada | Vote: | 0.2 | 0.1 | ||||||||||||
| Communist | Vote: | 0.1 | |||||||||||||
| Social Credit | Vote: | xx | |||||||||||||
| Other | Vote: | 0.4 | |||||||||||||
xx - less than 0.05% of the popular vote.
Note: Parties that captured less than 1% of the vote in a province are not recorded.
Images for kids
-
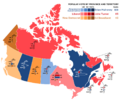
Map showing popular vote by province.
See also
 In Spanish: Elecciones federales de Canadá de 1988 para niños
