Alorton, Illinois facts for kids
Quick facts for kids
Alorton
|
|
|---|---|

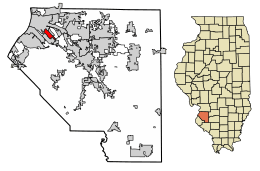
Location of Alorton in St. Clair County, Illinois.
|
|

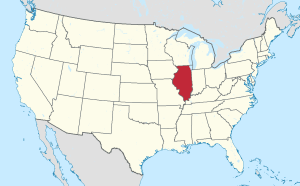
Location of Illinois in the United States
|
|
| Country | United States |
| State | Illinois |
| County | St. Clair |
| Incorporated | September 26, 1944 |
| Certified | December 4, 1944 |
| Dissolved | May 6, 2021 |
| Area | |
| • Total | 1.84 sq mi (4.76 km2) |
| • Land | 1.81 sq mi (4.68 km2) |
| • Water | 0.03 sq mi (0.08 km2) |
| Population
(2020)
|
|
| • Total | 1,566 |
| • Density | 1,051.44/sq mi (406.05/km2) |
| Time zone | UTC-6 (CST) |
| • Summer (DST) | UTC-5 (CDT) |
| ZIP Code(s) |
62207
|
| Area code(s) | 618 |
| FIPS code | 17-00958 |
Alorton was a village located in St. Clair County, Illinois, in the United States. It was first set up as a village in 1944.
Alorton was one of three towns that joined together to create a new city called Cahokia Heights. This merger happened on May 6, 2021. The other two towns that joined were the village of Cahokia and the city of Centreville. Just before it merged, Alorton had about 1,566 people living there in 2020.
The name Alorton probably comes from "aluminum ore town."
Where Was Alorton Located?
Alorton was located in St. Clair County, Illinois. You can find its exact spot using these coordinates: 38°35′3″N 90°7′4″W / 38.58417°N 90.11778°W.
In 2010, the village covered a total area of about 1.83 square miles (4.74 square kilometers). Most of this area was land, with a small part being water.
How Many People Lived There?
The number of people living in Alorton changed over the years. Here's a quick look at its population from different U.S. Census counts:
| Historical population | |||
|---|---|---|---|
| Census | Pop. | %± | |
| 1950 | 2,547 | — | |
| 1960 | 3,282 | 28.9% | |
| 1970 | 3,573 | 8.9% | |
| 1980 | 2,237 | −37.4% | |
| 1990 | 2,960 | 32.3% | |
| 2000 | 2,749 | −7.1% | |
| 2010 | 2,002 | −27.2% | |
| 2020 | 1,566 | −21.8% | |
| U.S. Decennial Census | |||
The population was highest in 1970 with 3,573 people. By 2020, just before it merged, the population was 1,566.
See also
 In Spanish: Alorton para niños
 | Roy Wilkins |
 | John Lewis |
 | Linda Carol Brown |

