Altamont, Utah facts for kids
Quick facts for kids
Altamont
|
|
|---|---|
|
Town
|
|

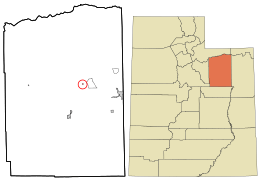
Location in Duchesne County and the state of Utah
|
|
| Country | United States |
| State | Utah |
| County | Duchesne |
| Settled | 1930s |
| Incorporated | 1953 |
| Named for | Altonah and Mount Emmons |
| Area | |
| • Total | 0.21 sq mi (0.55 km2) |
| • Land | 0.21 sq mi (0.55 km2) |
| • Water | 0.00 sq mi (0.00 km2) |
| Elevation | 6,391 ft (1,948 m) |
| Population
(2010)
|
|
| • Total | 225 |
| • Density | 1,306.60/sq mi (504.58/km2) |
| Time zone | UTC-7 (MST) |
| • Summer (DST) | UTC-6 (MDT) |
| ZIP code |
84001
|
| Area code(s) | 435 |
| FIPS code | 49-00760 |
| GNIS feature ID | 2412355 |
Altamont is a small town located in Duchesne County, Utah, in the United States. In 2010, about 225 people lived there. This was more than the 178 people who lived there in 2000.
Contents
History of Altamont
Altamont started in the 1930s. It was chosen as the perfect spot for a new high school. The school was built in 1935. It was named Altamont by combining two nearby village names. These villages were Altonah and Mount Emmons.
The community slowly grew bigger. In 1953, the people asked for Altamont to become an official town. A new part was added to the school in 2012.
Geography and Climate
Altamont is a very small town. According to the United States Census Bureau, it covers about 0.2 square miles (0.4 square kilometers). All of this area is land.
What is Altamont's Climate Like?
Altamont has a cold semi-arid climate. This means it gets very cold in winter. Summers are warm. It does not get a lot of rain or snow.
| Climate data for Altamont, Utah, 1991–2020 normals, extremes 1948–present | |||||||||||||
|---|---|---|---|---|---|---|---|---|---|---|---|---|---|
| Month | Jan | Feb | Mar | Apr | May | Jun | Jul | Aug | Sep | Oct | Nov | Dec | Year |
| Record high °F (°C) | 59 (15) |
69 (21) |
76 (24) |
86 (30) |
90 (32) |
98 (37) |
97 (36) |
95 (35) |
90 (32) |
80 (27) |
69 (21) |
64 (18) |
98 (37) |
| Mean maximum °F (°C) | 43.7 (6.5) |
50.4 (10.2) |
64.1 (17.8) |
73.3 (22.9) |
80.6 (27.0) |
88.1 (31.2) |
92.1 (33.4) |
89.8 (32.1) |
84.4 (29.1) |
73.1 (22.8) |
58.4 (14.7) |
46.6 (8.1) |
92.7 (33.7) |
| Mean daily maximum °F (°C) | 28.9 (−1.7) |
34.8 (1.6) |
47.0 (8.3) |
55.1 (12.8) |
64.2 (17.9) |
75.1 (23.9) |
82.4 (28.0) |
80.1 (26.7) |
71.0 (21.7) |
57.4 (14.1) |
42.6 (5.9) |
29.4 (−1.4) |
55.7 (13.2) |
| Daily mean °F (°C) | 17.8 (−7.9) |
23.1 (−4.9) |
33.9 (1.1) |
41.1 (5.1) |
50.2 (10.1) |
59.5 (15.3) |
66.9 (19.4) |
65.0 (18.3) |
56.1 (13.4) |
43.6 (6.4) |
30.5 (−0.8) |
18.9 (−7.3) |
42.2 (5.7) |
| Mean daily minimum °F (°C) | 6.7 (−14.1) |
11.5 (−11.4) |
20.9 (−6.2) |
27.2 (−2.7) |
36.2 (2.3) |
44.0 (6.7) |
51.5 (10.8) |
49.9 (9.9) |
41.2 (5.1) |
29.9 (−1.2) |
18.4 (−7.6) |
8.4 (−13.1) |
28.8 (−1.8) |
| Mean minimum °F (°C) | −7.1 (−21.7) |
−2.9 (−19.4) |
8.5 (−13.1) |
16.0 (−8.9) |
25.3 (−3.7) |
33.8 (1.0) |
44.2 (6.8) |
42.5 (5.8) |
30.8 (−0.7) |
17.8 (−7.9) |
5.8 (−14.6) |
−5.2 (−20.7) |
−10.5 (−23.6) |
| Record low °F (°C) | −30 (−34) |
−32 (−36) |
−11 (−24) |
5 (−15) |
16 (−9) |
25 (−4) |
34 (1) |
28 (−2) |
19 (−7) |
−6 (−21) |
−8 (−22) |
−32 (−36) |
−32 (−36) |
| Average precipitation inches (mm) | 0.69 (18) |
0.62 (16) |
0.53 (13) |
0.83 (21) |
1.08 (27) |
0.77 (20) |
0.60 (15) |
0.96 (24) |
1.24 (31) |
0.99 (25) |
0.51 (13) |
0.62 (16) |
9.44 (240) |
| Average snowfall inches (cm) | 10.8 (27) |
7.5 (19) |
3.0 (7.6) |
3.2 (8.1) |
0.1 (0.25) |
0.0 (0.0) |
0.0 (0.0) |
0.0 (0.0) |
0.1 (0.25) |
0.8 (2.0) |
4.2 (11) |
9.0 (23) |
38.7 (98) |
| Average precipitation days (≥ 0.01 in) | 4.7 | 4.9 | 4.0 | 5.2 | 6.7 | 4.8 | 5.2 | 6.6 | 5.9 | 5.1 | 4.2 | 4.6 | 61.9 |
| Average snowy days (≥ 0.1 in) | 4.3 | 4.0 | 1.9 | 1.4 | 0.1 | 0.0 | 0.0 | 0.0 | 0.0 | 0.5 | 2.2 | 4.3 | 18.7 |
| Source: NOAA | |||||||||||||
Population Information
| Historical population | |||
|---|---|---|---|
| Census | Pop. | %± | |
| 1960 | 102 | — | |
| 1970 | 129 | 26.5% | |
| 1980 | 247 | 91.5% | |
| 1990 | 167 | −32.4% | |
| 2000 | 178 | 6.6% | |
| 2010 | 225 | 26.4% | |
| 2019 (est.) | 277 | 23.1% | |
| U.S. Decennial Census | |||
In 2010, the census showed that 225 people lived in Altamont. These people lived in 83 different homes. Most of the people living there were White (96%). About 2% were Native American. About 1.3% of the people were Hispanic or Latino.
The population was made up of 46% males and 54% females. About 31.6% of the people were under 18 years old. About 12.9% were 65 years old or older.
Education in Altamont
Altamont is home to Altamont High School. The school's mascot is Louie the Longhorn. Altamont High School competes as a 1A school. They have local sports rivalries with schools in Duchesne and Tabiona.
See also
 In Spanish: Altamont (Utah) para niños
 | William L. Dawson |
 | W. E. B. Du Bois |
 | Harry Belafonte |


