Arboga Municipality facts for kids
Quick facts for kids
Arboga Municipality
Arboga kommun
|
||
|---|---|---|

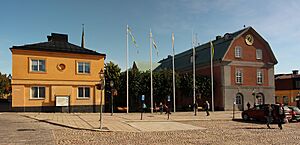
Arboga town hall
|
||
|
||
 |
||
| Country | Sweden | |
| County | Västmanland County | |
| Seat | Arboga | |
| Area | ||
| • Total | 421.67 km2 (162.81 sq mi) | |
| • Land | 327.26 km2 (126.36 sq mi) | |
| • Water | 94.41 km2 (36.45 sq mi) | |
| Area as of January 1, 2010. | ||
| Population
(June 30, 2012)
|
||
| • Total | 13,268 | |
| • Density | 31.4654/km2 (81.495/sq mi) | |
| Time zone | UTC+1 (CET) | |
| • Summer (DST) | UTC+2 (CEST) | |
| ISO 3166 code | SE | |
| Province | Västmanland and Närke | |
| Municipal code | 1984 | |
| Website | www.arboga.se | |
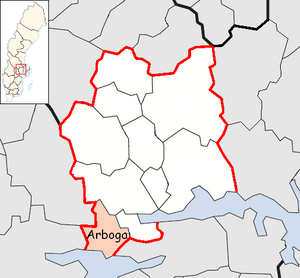
Arboga Municipality (which is called Arboga kommun in Swedish) is a special area in Västmanland County in central Sweden. It's like a local government area. The main town, or "seat," of this municipality is the city of Arboga.
In 1971, the old City of Arboga joined together with a part of the nearby rural area called Medåker. This created a new, bigger municipality. A few years later, in 1974, another area called Götlanda was added. It moved from a different county, Örebro County, to become part of Arboga Municipality.
Towns and Villages
Arboga Municipality is home to several towns and villages. The main town is Arboga, which is where the local government offices are located. Other important places include:
People and Population
Arboga Municipality is home to many people. In 2022, there were about 14,061 people living here. Out of these, around 10,941 were Swedish citizens old enough to vote. People in the municipality vote for different political groups to represent them. For example, in the 2022 election, about 47.3% of people voted for groups on the "left side" of politics, and 51.6% voted for groups on the "right side."
How People Vote in National Elections
People in Arboga Municipality also vote in the national elections for the Riksdag, which is like Sweden's parliament. The way people vote can change over time. Here's a look at how votes have been cast for different political parties in past national elections:
| Year | % | Votes | V | S | MP | C | L | KD | M | SD | NyD | Left | Right |
|---|---|---|---|---|---|---|---|---|---|---|---|---|---|
| 1973 | 91.6 | 9,486 | 4.3 | 50.7 | 24.4 | 9.1 | 1.0 | 10.3 | 55.0 | 43.8 | |||
| 1976 | 92.9 | 9,789 | 3.4 | 49.9 | 23.6 | 10.4 | 1.1 | 11.4 | 53.3 | 45.4 | |||
| 1979 | 91.0 | 9,853 | 4.2 | 51.0 | 17.1 | 10.7 | 1.2 | 15.2 | 55.2 | 43.0 | |||
| 1982 | 91.8 | 10,019 | 4.3 | 53.7 | 1.3 | 15.3 | 5.8 | 1.9 | 17.6 | 58.0 | 38.7 | ||
| 1985 | 90.1 | 9,859 | 4.4 | 53.2 | 1.7 | 12.2 | 12.2 | 16.2 | 57.6 | 40.6 | |||
| 1988 | 85.5 | 9,321 | 5.4 | 50.3 | 4.9 | 11.2 | 10.5 | 2.5 | 14.2 | 60.6 | 35.9 | ||
| 1991 | 86.3 | 9,499 | 4.2 | 45.3 | 3.5 | 8.4 | 8.8 | 6.7 | 17.2 | 5.3 | 49.5 | 41.1 | |
| 1994 | 87.0 | 9,510 | 6.7 | 50.9 | 5.7 | 7.1 | 6.6 | 3.5 | 17.5 | 1.0 | 63.3 | 34.7 | |
| 1998 | 82.0 | 8,589 | 13.5 | 41.9 | 5.9 | 5.2 | 4.1 | 10.7 | 17.9 | 61.3 | 37.9 | ||
| 2002 | 79.8 | 8,169 | 8.8 | 44.3 | 5.2 | 6.9 | 12.3 | 8.3 | 11.6 | 1.0 | 58.3 | 39.1 | |
| 2006 | 81.0 | 8,207 | 6.4 | 42.1 | 3.9 | 8.8 | 6.6 | 5.2 | 21.1 | 2.5 | 52.4 | 41.7 | |
| 2010 | 83.6 | 8,565 | 5.7 | 37.6 | 6.3 | 5.8 | 6.8 | 4.5 | 26.4 | 6.0 | 49.6 | 43.5 | |
| 2014 | 85.2 | 8,975 | 5.0 | 38.3 | 5.2 | 5.5 | 3.9 | 3.5 | 20.6 | 15.5 | 48.5 | 33.5 | |
| 2018 | 87.5 | 9,233 | 5.8 | 33.8 | 3.2 | 6.8 | 3.9 | 5.1 | 18.7 | 21.7 | 49.5 | 49.4 | |
| 2022 | 84.0 | 9,081 | 4.8 | 33.8 | 3.5 | 5.2 | 3.6 | 4.8 | 17.6 | 25.6 | 47.3 | 51.6 |
See also
 In Spanish: Municipio de Arboga para niños


