Bolsover (UK Parliament constituency) facts for kids
Quick facts for kids {{{Name}}}[[{{{Type}}} constituency]] |
|
|---|---|
| [[Image:{{{Map1}}}Constituency.svg|120px|]] [[Image:England{{{Map2}}}.svg|120px|]] |
|
| {{{Name}}} shown within [[{{{Entity}}}]], and {{{Entity}}} shown within England | |
| Created: | {{{Year}}} |
| MP: | {{{MP}}} |
| Party: | {{{Party}}} |
| Type: | House of Commons |
| County: | [[{{{County}}}]] |
| EP constituency: | [[{{{EP}}} (European Parliament constituency)|{{{EP}}}]] |
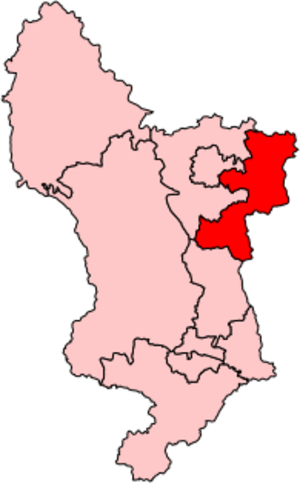
Bolsover is a special area in Derbyshire, England. It's called a constituency because people who live here get to choose one person to represent them in the UK Parliament. This person is called a Member of Parliament (MP).
Since 2019, the MP for Bolsover has been Mark Fletcher from the Conservative Party. Before him, Dennis Skinner from the Labour Party was the MP for nearly 50 years, from 1970 to 2019.
Contents
What are Bolsover's Boundaries?
A constituency's "boundaries" are like its borders. They show exactly which towns and areas are part of Bolsover for elections. The Bolsover constituency was first created in 1950. Since then, its shape has changed a few times.
- 1950–1983: It included the Bolsover Urban District and the rural areas of Blackwell and Clowne.
- 1983–2010: The area grew to include the District of Bolsover and parts of North East Derbyshire, like Morton, Pilsley, Shirland, and Sutton.
- 2010–Present: Today, it still covers the District of Bolsover. It also includes different parts of North East Derbyshire, such as Holmewood and Heath, Pilsley and Morton, Shirland, and Sutton.
Who are the Members of Parliament for Bolsover?
A Member of Parliament (MP) is a person elected by the people in a constituency to speak for them in the House of Commons in London. They help make laws and discuss important issues for the country and their local area.
Here are the people who have been the MP for Bolsover:
| Election | Member | Party | |
|---|---|---|---|
| 1950 | Harold Neal | Labour | |
| 1970 | Dennis Skinner | ||
| 2019 | Mark Fletcher | Conservative | |
How Do Elections Work in Bolsover?
Elections are how people choose their MP. Every few years, people in Bolsover get to vote for the person they want to represent them in Parliament. The person who gets the most votes wins and becomes the MP.
The 2019 General Election
The most recent election was in 2019. This election was a big change for Bolsover. For almost 50 years, the MP had been Dennis Skinner from the Labour Party. However, in 2019, Mark Fletcher from the Conservative Party won the election.
- Mark Fletcher (Conservative Party) received 21,791 votes, which was 47.4% of all votes.
- Dennis Skinner (Labour Party) received 16,492 votes, which was 35.9% of all votes.
- Other candidates from different parties also ran, including the Brexit Party, Liberal Democrats, Green Party, and some independent candidates.
Mark Fletcher won by 5,299 votes. This meant he had 11.5% more votes than Dennis Skinner. About 61.1% of people who could vote in Bolsover actually voted in this election.
Previous Elections
Before 2019, Bolsover had been represented by a Labour MP for a very long time.
- In the 2017 election, Dennis Skinner (Labour) won with 24,153 votes (51.9%). Helen Harrison (Conservative) came second with 18,865 votes (40.5%).
- In the 2015 election, Dennis Skinner (Labour) won with 22,542 votes (51.2%). Peter Bedford (Conservative) was second with 10,764 votes (24.5%).
- In the 2010 election, Dennis Skinner (Labour) won with 21,994 votes (50.0%). Lee Rowley (Conservative) was second with 10,812 votes (24.6%).
These results show how the support for different political parties has changed over the years in Bolsover.
 | Stephanie Wilson |
 | Charles Bolden |
 | Ronald McNair |
 | Frederick D. Gregory |


