Bonfield, Illinois facts for kids
Quick facts for kids
Bonfield, Illinois
|
|
|---|---|

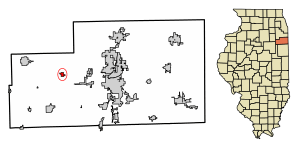
Location of Bonfield in Illinois
|
|

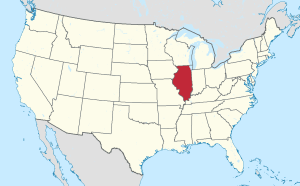
Location of Illinois in the United States
|
|
| Country | United States |
| State | Illinois |
| County | Kankakee |
| Township | Salina |
| Area | |
| • Total | 0.49 sq mi (1.27 km2) |
| • Land | 0.49 sq mi (1.27 km2) |
| • Water | 0.00 sq mi (0.00 km2) |
| Elevation | 623 ft (190 m) |
| Population
(2020)
|
|
| • Total | 351 |
| • Density | 713.41/sq mi (275.60/km2) |
| Time zone | UTC-6 (CST) |
| • Summer (DST) | UTC-5 (CDT) |
| Area codes | 815 & 779 |
| FIPS code | 17-07237 |
| GNIS feature ID | 2398151 |
| Wikimedia Commons | Bonfield, Illinois |
Bonfield is a small village located in Kankakee County, Illinois, United States. In 2020, about 351 people lived there. Bonfield is part of the larger Kankakee-Bradley area.
The village of Bonfield was started by a quarryman named Thomas Verkler. A quarryman works with stone, often digging it out of the ground. However, the village was named after Thomas Bonfield. He was a lawyer for the Kankakee & Seneca Railroad Company. This company built a train station, called a depot, in the village.
The railroad is no longer there, but it used to run along Johnson Street. Sometimes, old railroad spikes or ties can still be found near the limestone quarry. The old train depot was moved about a mile and a half south of the village. It was turned into a barn, and it was still there in 2007. Bonfield also used to have its own high school. Sadly, it burned down in the early 1930s. After that, students from Bonfield went to Herscher High School in Herscher.
Where is Bonfield Located?
Bonfield is in the western part of Kankakee County. It is about 12 miles (19 km) west of Kankakee. Kankakee is the main city and county seat for the area.
According to information from 2010, Bonfield covers a total area of about 0.49 square miles (1.27 square kilometers). All of this area is land.
Who Lives in Bonfield?
| Historical population | |||
|---|---|---|---|
| Census | Pop. | %± | |
| 1890 | 150 | — | |
| 1900 | 165 | 10.0% | |
| 1910 | 162 | −1.8% | |
| 1920 | 126 | −22.2% | |
| 1930 | 116 | −7.9% | |
| 1940 | 116 | 0.0% | |
| 1950 | 143 | 23.3% | |
| 1960 | 178 | 24.5% | |
| 1970 | 241 | 35.4% | |
| 1980 | 294 | 22.0% | |
| 1990 | 299 | 1.7% | |
| 2000 | 364 | 21.7% | |
| 2010 | 382 | 4.9% | |
| 2020 | 351 | −8.1% | |
| U.S. Decennial Census | |||
Let's look at some facts about the people who live in Bonfield. In the year 2000, there were 364 people living in the village. These people lived in 122 households, and 102 of these were families.
The population density was about 1,329 people per square mile. This means how many people live in a certain amount of space. Most of the people living in Bonfield were White (98.35%). A small number (1.37%) were of Hispanic or Latino background.
Many households in Bonfield had children. About 46.7% of households had children under 18 living with them. Most households (73.0%) were married couples living together. About 10.7% of households had a female head with no husband present.
The average household had about 2.98 people. The average family had about 3.26 people. The median age of people in Bonfield was 33 years old. This means half the people were younger than 33 and half were older.
About 32.1% of the population was under 18 years old. About 32.7% were between 25 and 44 years old.
In 2000, the median household income was $49,722. This is the middle income for all households. The median family income was $55,972. The average income per person was $18,531. A very small number of families and people lived below the poverty line.
See also
 In Spanish: Bonfield para niños
 | Kyle Baker |
 | Joseph Yoakum |
 | Laura Wheeler Waring |
 | Henry Ossawa Tanner |

