
Clifton, Arizona facts for kids
Quick facts for kids
Clifton, Arizona
|
||
|---|---|---|

Old train depot, built 1913, now used by the Chamber of Commerce
|
||
|
||
| Motto(s):
"Where the trail begins"
|
||

Location of Clifton in Greenlee County, Arizona
|
||

Clifton, Arizona
Location in Arizona

Clifton, Arizona
Location in the United States
|
||
| Country | United States | |
| State | Arizona | |
| County | Greenlee | |
| Area | ||
| • Total | 14.84 sq mi (38.44 km2) | |
| • Land | 14.62 sq mi (37.87 km2) | |
| • Water | 0.22 sq mi (0.57 km2) | |
| Elevation | 3,875 ft (1,181 m) | |
| Population
(2020)
|
||
| • Total | 3,933 | |
| • Density | 268.98/sq mi (103.85/km2) | |
| Time zone | UTC-7 (MST (no DST)) | |
| ZIP code |
85533
|
|
| Area code(s) | 928 | |
| FIPS code | 04-14380 | |
| GNIS feature ID | 2413215 | |

Clifton is a town located in Greenlee County, Arizona, United States. It is the main town, also known as the county seat, for Greenlee County. The town sits right next to the San Francisco River.
In 2020, about 3,933 people lived in Clifton. The town was also a place where workers at the copper mines had disagreements about their jobs in 1983. Clifton and a nearby town called Morenci are seen as an important economic area by the state of Arizona.
Contents
Exploring Clifton's Location and Weather
Clifton covers an area of about 14.84 square miles (38.44 square kilometers). Most of this area is land, with a small part being water.
Clifton's Climate: Hot and Dry
Clifton has a hot semi-arid climate. This means it's usually hot and dry, but not quite a full desert. The weather can change a lot between day and night. Summers are very hot and sometimes a bit humid. Most of the rain comes during the monsoon season, which is from July to October.
The year 2004 was the wettest, with over 28 inches of rain. The driest year on record was 1924, with less than 5 inches of rain. Winters in Clifton are mild, meaning not too cold, but the nights can be very chilly. Snow doesn't fall often; it has only been recorded in 14 years since 1892.
| Climate data for Clifton, Arizona (1991–2020 normals, extremes 1908–2012) | |||||||||||||
|---|---|---|---|---|---|---|---|---|---|---|---|---|---|
| Month | Jan | Feb | Mar | Apr | May | Jun | Jul | Aug | Sep | Oct | Nov | Dec | Year |
| Record high °F (°C) | 83 (28) |
87 (31) |
92 (33) |
99 (37) |
108 (42) |
116 (47) |
115 (46) |
113 (45) |
110 (43) |
102 (39) |
94 (34) |
80 (27) |
116 (47) |
| Mean maximum °F (°C) | 70.1 (21.2) |
76.2 (24.6) |
84.5 (29.2) |
92.4 (33.6) |
101.2 (38.4) |
108.3 (42.4) |
109.2 (42.9) |
105.4 (40.8) |
100.8 (38.2) |
94.0 (34.4) |
80.3 (26.8) |
70.4 (21.3) |
110.3 (43.5) |
| Mean daily maximum °F (°C) | 61.2 (16.2) |
65.9 (18.8) |
73.2 (22.9) |
81.2 (27.3) |
90.0 (32.2) |
100.0 (37.8) |
100.4 (38.0) |
97.5 (36.4) |
92.5 (33.6) |
82.6 (28.1) |
69.8 (21.0) |
59.6 (15.3) |
81.2 (27.3) |
| Daily mean °F (°C) | 48.1 (8.9) |
52.5 (11.4) |
59.3 (15.2) |
66.1 (18.9) |
74.3 (23.5) |
84.4 (29.1) |
87.4 (30.8) |
84.6 (29.2) |
79.2 (26.2) |
68.8 (20.4) |
55.7 (13.2) |
47.3 (8.5) |
67.3 (19.6) |
| Mean daily minimum °F (°C) | 35.1 (1.7) |
39.1 (3.9) |
45.3 (7.4) |
51.0 (10.6) |
58.7 (14.8) |
68.9 (20.5) |
74.4 (23.6) |
71.6 (22.0) |
65.9 (18.8) |
54.9 (12.7) |
41.5 (5.3) |
35.0 (1.7) |
53.5 (11.9) |
| Mean minimum °F (°C) | 26.3 (−3.2) |
30.4 (−0.9) |
33.3 (0.7) |
40.7 (4.8) |
49.2 (9.6) |
59.4 (15.2) |
66.7 (19.3) |
64.4 (18.0) |
55.6 (13.1) |
41.1 (5.1) |
30.8 (−0.7) |
24.5 (−4.2) |
23.4 (−4.8) |
| Record low °F (°C) | 4 (−16) |
17 (−8) |
22 (−6) |
26 (−3) |
34 (1) |
46 (8) |
45 (7) |
51 (11) |
39 (4) |
32 (0) |
20 (−7) |
12 (−11) |
4 (−16) |
| Average precipitation inches (mm) | 1.25 (32) |
1.53 (39) |
0.85 (22) |
0.47 (12) |
0.49 (12) |
0.43 (11) |
3.12 (79) |
3.28 (83) |
1.71 (43) |
1.45 (37) |
1.33 (34) |
1.11 (28) |
17.02 (432) |
| Average precipitation days (≥ 0.01 inch) | 4.1 | 5.0 | 3.6 | 1.9 | 2.3 | 2.4 | 8.5 | 10.6 | 5.9 | 3.6 | 3.4 | 4.1 | 55.4 |
| Source: NWS – National Oceanic and Atmospheric Administration | |||||||||||||
Who Lives in Clifton?
| Historical population | |||
|---|---|---|---|
| Census | Pop. | %± | |
| 1890 | 600 | — | |
| 1910 | 4,874 | — | |
| 1920 | 4,163 | −14.6% | |
| 1930 | 2,305 | −44.6% | |
| 1940 | 2,668 | 15.7% | |
| 1950 | 3,466 | 29.9% | |
| 1960 | 4,191 | 20.9% | |
| 1970 | 5,087 | 21.4% | |
| 1980 | 4,245 | −16.6% | |
| 1990 | 2,840 | −33.1% | |
| 2000 | 2,596 | −8.6% | |
| 2010 | 3,311 | 27.5% | |
| 2020 | 3,933 | 18.8% | |
| U.S. Decennial Census | |||
In 2000, there were 2,596 people living in Clifton. They lived in 919 households, with 685 of these being families. The town had about 175 people per square mile.
Many different groups of people live in Clifton. About 67% of the people were White, and about 27% were from other races. Over half of the people (55.9%) were Hispanic or Latino.
Families and Ages in Clifton
About 41% of households in Clifton had children under 18 living there. Most households (57%) were married couples living together. About 10% of households were led by a single mother.
The average household had 2.80 people, and the average family had 3.27 people. The population was quite young, with about 32% of residents being under 18 years old. The average age in Clifton was 32 years.
Money Matters in Clifton
In 2000, the average income for a household in Clifton was about $39,786 per year. For families, the average income was a bit higher, around $41,820. Men generally earned more than women.
About 11.5% of all people in Clifton lived below the poverty line. This included about 12.4% of children under 18 and 10.3% of people aged 65 or older.
Getting Around Clifton
Clifton has several ways for people to travel. U.S. Route 191 is a main road that goes through the town. There is also the Greenlee County Airport for air travel. For moving goods, the Arizona Eastern Railway serves the area.
Learning in Clifton
Since 2010, students in Clifton attend schools in the Morenci Unified School District. Before that, Clifton had its own school district, but it closed.
Images for kids
-
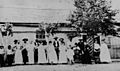
Hovey's Dance Hall in Clifton in 1884
-
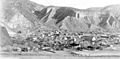
Clifton in 1903
-
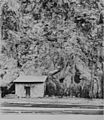
The Clifton Cliff Jail, sometime before it closed in 1906
-
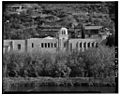
Clifton Mineral Hot Springs Bathhouse, which was built in 1928
-
Clifton Townsite Historic District in 1993


See also
 In Spanish: Clifton (Arizona) para niños
