Climate of New Jersey facts for kids

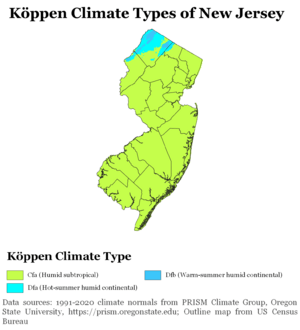
The climate of New Jersey is a mix of different weather types. South Jersey has a humid subtropical climate. This means it has hot, humid summers and mild winters. North Jersey, especially the northwestern part, has a humid continental climate. This brings warm summers and cold, snowy winters.
The northwestern part of New Jersey gets the most snow. This is because it has higher elevations. In winter, New Jersey can get big snowstorms called Nor'easters. These storms affect the whole Northeastern United States. Sometimes, snowstorms turn into rain. This happens when warm air from the Atlantic Ocean is pulled into the storm. New Jersey's weather is greatly affected by how close it is to the ocean. The ocean adds moisture to the air and keeps temperatures from getting too extreme.
Scientists have studied New Jersey's climate. They found that New Jersey has been warming faster than any other U.S. state. This warming trend has been happening for over 100 years. It is linked to global warming.
Contents
Temperatures Across New Jersey
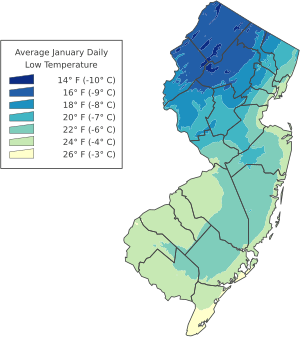
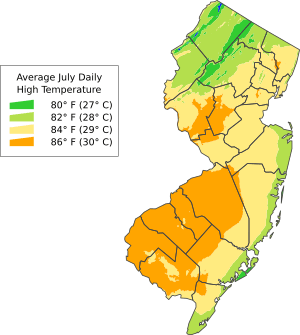
Temperatures in New Jersey change depending on where you are. The northwestern part of the state is usually the coolest. The southern part is typically the warmest. This temperature difference is biggest in winter. It is smallest during the summer months.
Every part of New Jersey has seen very cold and very hot temperatures. The state has recorded temperatures below 0 degrees Fahrenheit. It has also seen temperatures above 100 degrees Fahrenheit. The highest temperature ever recorded was 110°F. This happened on July 10, 1936, in Runyon. The lowest temperature was -34°F. This was recorded in River Vale on January 5, 1904.
The number of days without frost varies. It ranges from 163 days in the highlands. Along the coast, it can be up to 217 days. This means plants have a longer growing season near the ocean.
Rain and Storms
New Jersey gets a good amount of rain each year. The average rainfall is about 40 inches along the southeastern coast. In the north-central part of the state, it can be around 51 inches.
Autumn is usually the driest season. On average, it has about 8 days with rain each month. Other seasons have more rain. They typically see between 9 and 12 days of rain per month. Most areas in New Jersey experience 25 to 30 thunderstorms every year.
Tornadoes are possible in New Jersey, but they are rare. When they do happen, they are usually not very strong. About five tornadoes are reported across the state each year. The most rain ever recorded in 24 hours was 14.81 inches. This happened in Tuckerton in August 1939.
Snowfall in New Jersey
Snow is quite common in New Jersey. Most of the snow falls between November 15 and April 15. Heavy snowfall is much less common along the coastline. It is also less common in South Jersey. Interior North Jersey gets much more significant snow.
The record for the most snow in 24 hours is 32 inches. This happened in Rutherford on December 14, 1915. The deepest snow ever recorded was 52 inches. This was at the Canistear Reservoir in Vernon Township on February 5, 1961.
Climate Change in New Jersey
Climate change is affecting New Jersey faster than many other places in the United States. New Jersey has warmed up more quickly than any other U.S. state. This warming trend has been observed over the last 100 years.
New Jersey has also seen a lot of growth. Many cities and suburbs have been built over the past century. This development has added to the warming effect. This is called the "urban heat island effect." It means that cities and developed areas tend to be warmer than rural areas. This is partly because New Jersey is a small state with many developed areas.
Climate Data for Cities
| Climate data for Atlantic City, New Jersey (downtown), 1981–2010 normals, extremes 1874–present | |||||||||||||
|---|---|---|---|---|---|---|---|---|---|---|---|---|---|
| Month | Jan | Feb | Mar | Apr | May | Jun | Jul | Aug | Sep | Oct | Nov | Dec | Year |
| Record high °F (°C) | 72 (22) |
77 (25) |
84 (29) |
91 (33) |
95 (35) |
99 (37) |
102 (39) |
104 (40) |
94 (34) |
91 (33) |
80 (27) |
74 (23) |
104 (40) |
| Mean maximum °F (°C) | 59.3 (15.2) |
59.9 (15.5) |
68.4 (20.2) |
77.3 (25.2) |
83.7 (28.7) |
89.7 (32.1) |
93.5 (34.2) |
91.8 (33.2) |
86.3 (30.2) |
78.9 (26.1) |
70.1 (21.2) |
62.4 (16.9) |
95.3 (35.2) |
| Mean daily maximum °F (°C) | 41.8 (5.4) |
43.5 (6.4) |
49.6 (9.8) |
57.6 (14.2) |
66.6 (19.2) |
75.7 (24.3) |
81.3 (27.4) |
80.2 (26.8) |
74.8 (23.8) |
65.0 (18.3) |
55.8 (13.2) |
46.3 (7.9) |
61.6 (16.4) |
| Mean daily minimum °F (°C) | 29.2 (−1.6) |
30.9 (−0.6) |
36.9 (2.7) |
45.5 (7.5) |
54.5 (12.5) |
64.3 (17.9) |
70.0 (21.1) |
69.7 (20.9) |
63.5 (17.5) |
52.5 (11.4) |
42.9 (6.1) |
33.5 (0.8) |
49.5 (9.7) |
| Mean minimum °F (°C) | 11.3 (−11.5) |
16.3 (−8.7) |
22.4 (−5.3) |
33.8 (1.0) |
44.3 (6.8) |
53.7 (12.1) |
61.4 (16.3) |
60.1 (15.6) |
50.5 (10.3) |
39.2 (4.0) |
29.0 (−1.7) |
19.0 (−7.2) |
10.1 (−12.2) |
| Record low °F (°C) | −4 (−20) |
−9 (−23) |
8 (−13) |
15 (−9) |
33 (1) |
45 (7) |
52 (11) |
48 (9) |
37 (3) |
27 (−3) |
10 (−12) |
−7 (−22) |
−9 (−23) |
| Average precipitation inches (mm) | 3.08 (78) |
2.87 (73) |
4.02 (102) |
3.39 (86) |
3.22 (82) |
2.68 (68) |
3.31 (84) |
3.92 (100) |
3.08 (78) |
3.47 (88) |
3.35 (85) |
3.62 (92) |
40.01 (1,016) |
| Average snowfall inches (cm) | 4.5 (11) |
6.7 (17) |
1.1 (2.8) |
0.3 (0.76) |
0 (0) |
0 (0) |
0 (0) |
0 (0) |
0 (0) |
0 (0) |
0.2 (0.51) |
3.7 (9.4) |
16.5 (42) |
| Average precipitation days (≥ 0.01 in) | 9.3 | 9.0 | 10.5 | 10.9 | 10.4 | 8.7 | 8.4 | 8.0 | 7.7 | 7.6 | 8.9 | 10.4 | 109.8 |
| Average snowy days (≥ 0.1 in) | 2.9 | 2.8 | 0.9 | 0.3 | 0 | 0 | 0 | 0 | 0 | 0 | 0.1 | 1.7 | 8.7 |
| Average relative humidity (%) | 69.5 | 69.0 | 66.9 | 66.4 | 70.7 | 72.9 | 73.9 | 75.7 | 76.4 | 74.8 | 72.8 | 70.6 | 71.6 |
| Mean monthly sunshine hours | 150.8 | 157.9 | 204.5 | 218.9 | 243.9 | 266.2 | 276.3 | 271.3 | 227.6 | 200.5 | 147.4 | 133.8 | 2,499.1 |
| Percent possible sunshine | 50 | 53 | 55 | 55 | 55 | 60 | 61 | 64 | 61 | 58 | 49 | 46 | 56 |
| Source: NOAA (relative humidity and sun 1961–1990 and snow at Atlantic City Int'l) | |||||||||||||
| Climate data for Newark, New Jersey (Newark Liberty Int'l), 1991–2020 normals, extremes 1931–present | |||||||||||||
|---|---|---|---|---|---|---|---|---|---|---|---|---|---|
| Month | Jan | Feb | Mar | Apr | May | Jun | Jul | Aug | Sep | Oct | Nov | Dec | Year |
| Record high °F (°C) | 74 (23) |
80 (27) |
89 (32) |
97 (36) |
99 (37) |
103 (39) |
108 (42) |
105 (41) |
105 (41) |
96 (36) |
85 (29) |
76 (24) |
108 (42) |
| Mean maximum °F (°C) | 62 (17) |
63 (17) |
72 (22) |
84 (29) |
91 (33) |
96 (36) |
99 (37) |
96 (36) |
91 (33) |
82 (28) |
72 (22) |
64 (18) |
100 (38) |
| Mean daily maximum °F (°C) | 40.0 (4.4) |
43.0 (6.1) |
50.9 (10.5) |
62.6 (17.0) |
72.6 (22.6) |
81.8 (27.7) |
86.9 (30.5) |
84.7 (29.3) |
77.7 (25.4) |
66.0 (18.9) |
54.9 (12.7) |
44.8 (7.1) |
63.8 (17.7) |
| Daily mean °F (°C) | 32.8 (0.4) |
35.1 (1.7) |
42.5 (5.8) |
53.3 (11.8) |
63.3 (17.4) |
72.7 (22.6) |
78.2 (25.7) |
76.4 (24.7) |
69.2 (20.7) |
57.5 (14.2) |
47.0 (8.3) |
38.0 (3.3) |
55.5 (13.1) |
| Mean daily minimum °F (°C) | 25.5 (−3.6) |
27.2 (−2.7) |
34.2 (1.2) |
44.1 (6.7) |
53.9 (12.2) |
63.6 (17.6) |
69.4 (20.8) |
68.0 (20.0) |
60.7 (15.9) |
49.0 (9.4) |
39.0 (3.9) |
31.2 (−0.4) |
47.1 (8.4) |
| Mean minimum °F (°C) | 9 (−13) |
12 (−11) |
19 (−7) |
32 (0) |
43 (6) |
53 (12) |
62 (17) |
59 (15) |
48 (9) |
36 (2) |
26 (−3) |
17 (−8) |
7 (−14) |
| Record low °F (°C) | −8 (−22) |
−14 (−26) |
6 (−14) |
16 (−9) |
33 (1) |
41 (5) |
51 (11) |
45 (7) |
35 (2) |
25 (−4) |
12 (−11) |
−8 (−22) |
−14 (−26) |
| Average precipitation inches (mm) | 3.42 (87) |
2.98 (76) |
4.13 (105) |
3.87 (98) |
3.97 (101) |
4.34 (110) |
4.66 (118) |
4.15 (105) |
3.82 (97) |
3.79 (96) |
3.33 (85) |
4.14 (105) |
46.60 (1,184) |
| Average snowfall inches (cm) | 9.1 (23) |
10.1 (26) |
5.6 (14) |
0.5 (1.3) |
0.0 (0.0) |
0.0 (0.0) |
0.0 (0.0) |
0.0 (0.0) |
0.0 (0.0) |
0.2 (0.51) |
0.6 (1.5) |
5.4 (14) |
31.5 (80) |
| Average precipitation days (≥ 0.01 in) | 10.6 | 10.0 | 10.9 | 11.5 | 11.4 | 10.9 | 10.0 | 9.8 | 8.7 | 9.4 | 8.8 | 11.1 | 123.1 |
| Average snowy days (≥ 0.1 in) | 4.6 | 3.8 | 2.7 | 0.3 | 0.0 | 0.0 | 0.0 | 0.0 | 0.0 | 0.0 | 0.3 | 2.8 | 14.5 |
| Average ultraviolet index | 2 | 3 | 4 | 6 | 7 | 8 | 8 | 8 | 6 | 4 | 2 | 1 | 5 |
| Source 1: NOAA | |||||||||||||
| Source 2: Weather Atlas (UV) | |||||||||||||
| Climate data for Newark | |||||||||||||
|---|---|---|---|---|---|---|---|---|---|---|---|---|---|
| Month | Jan | Feb | Mar | Apr | May | Jun | Jul | Aug | Sep | Oct | Nov | Dec | Year |
| Average sea temperature °F (°C) | 41.7 (5.4) |
39.7 (4.3) |
40.2 (4.5) |
45.1 (7.3) |
52.5 (11.4) |
64.5 (18.1) |
72.1 (22.3) |
74.1 (23.4) |
70.1 (21.2) |
63.0 (17.3) |
54.3 (12.4) |
47.2 (8.4) |
55.4 (13.0) |
| Source: Weather Atlas | |||||||||||||
| Climate data for Trenton, New Jersey (Trenton–Mercer Airport) 1991–2020 normals, extremes 1865–present | |||||||||||||
|---|---|---|---|---|---|---|---|---|---|---|---|---|---|
| Month | Jan | Feb | Mar | Apr | May | Jun | Jul | Aug | Sep | Oct | Nov | Dec | Year |
| Record high °F (°C) | 73 (23) |
78 (26) |
87 (31) |
93 (34) |
99 (37) |
100 (38) |
106 (41) |
105 (41) |
101 (38) |
94 (34) |
83 (28) |
76 (24) |
106 (41) |
| Mean maximum °F (°C) | 62 (17) |
62 (17) |
73 (23) |
84 (29) |
88 (31) |
93 (34) |
96 (36) |
94 (34) |
90 (32) |
82 (28) |
72 (22) |
65 (18) |
97 (36) |
| Mean daily maximum °F (°C) | 39.7 (4.3) |
42.8 (6.0) |
50.8 (10.4) |
62.9 (17.2) |
72.4 (22.4) |
81.0 (27.2) |
86.0 (30.0) |
84.0 (28.9) |
77.1 (25.1) |
65.5 (18.6) |
54.5 (12.5) |
44.4 (6.9) |
63.4 (17.4) |
| Daily mean °F (°C) | 32.0 (0.0) |
34.3 (1.3) |
41.7 (5.4) |
52.5 (11.4) |
62.0 (16.7) |
71.0 (21.7) |
76.3 (24.6) |
74.4 (23.6) |
67.4 (19.7) |
55.7 (13.2) |
45.4 (7.4) |
36.8 (2.7) |
54.1 (12.3) |
| Mean daily minimum °F (°C) | 24.3 (−4.3) |
25.9 (−3.4) |
32.7 (0.4) |
42.1 (5.6) |
51.6 (10.9) |
60.9 (16.1) |
66.6 (19.2) |
64.8 (18.2) |
57.7 (14.3) |
45.9 (7.7) |
36.3 (2.4) |
29.3 (−1.5) |
44.8 (7.1) |
| Mean minimum °F (°C) | 8 (−13) |
11 (−12) |
19 (−7) |
29 (−2) |
38 (3) |
49 (9) |
58 (14) |
55 (13) |
45 (7) |
32 (0) |
23 (−5) |
16 (−9) |
6 (−14) |
| Record low °F (°C) | −16 (−27) |
−14 (−26) |
0 (−18) |
11 (−12) |
31 (−1) |
39 (4) |
46 (8) |
39 (4) |
34 (1) |
21 (−6) |
9 (−13) |
−8 (−22) |
−16 (−27) |
| Average precipitation inches (mm) | 3.29 (84) |
2.63 (67) |
3.97 (101) |
3.63 (92) |
3.99 (101) |
4.25 (108) |
4.39 (112) |
4.22 (107) |
4.09 (104) |
3.79 (96) |
3.18 (81) |
4.04 (103) |
45.47 (1,155) |
| Average precipitation days (≥ 0.01 in) | 10.1 | 10.1 | 11.0 | 11.5 | 12.0 | 11.9 | 10.8 | 10.0 | 8.6 | 10.0 | 8.5 | 11.0 | 125.5 |
| Average relative humidity (%) | 65.4 | 61.7 | 58.0 | 57.0 | 62.1 | 66.1 | 66.2 | 68.8 | 69.8 | 68.8 | 66.9 | 66.5 | 64.8 |
| Average dew point °F (°C) | 21.7 (−5.7) |
22.8 (−5.1) |
28.1 (−2.2) |
37.7 (3.2) |
48.7 (9.3) |
59.4 (15.2) |
63.9 (17.7) |
63.5 (17.5) |
57.0 (13.9) |
45.6 (7.6) |
35.9 (2.2) |
26.5 (−3.1) |
42.7 (5.9) |
| Mean monthly sunshine hours | 163.1 | 169.7 | 207.4 | 227.2 | 248.1 | 262.8 | 269.2 | 252.5 | 215.0 | 201.5 | 149.3 | 140.1 | 2,505.9 |
| Percent possible sunshine | 54 | 57 | 56 | 57 | 56 | 58 | 59 | 59 | 57 | 58 | 50 | 48 | 56 |
| Source 1: NOAA (sun 1961–1981) | |||||||||||||
| Source 2: PRISM Climate Group (humidity and dew point) | |||||||||||||


