Cobleskill Creek facts for kids
Quick facts for kids Cobleskill Creek |
|
|---|---|
|
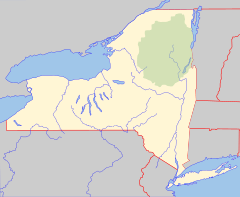
Location of the mouth within New York
|
|
| Country | United States |
| State | New York |
| Counties | Otsego, Schoharie |
| Physical characteristics | |
| Main source | Pine Mountain West of West Richmondville 42°39′02″N 74°38′55″W / 42.6505953°N 74.6485376°W |
| River mouth | Schoharie Creek Fort Hunter 927 ft (283 m) 42°42′40″N 74°19′36″W / 42.7111862°N 74.3267994°W |
| Basin features | |
| Basin size | 139 sq mi (360 km2) |
| Tributaries |
|
Cobleskill Creek is a natural waterway located in New York. It starts its journey at Pine Mountain, which is west of a place called West Richmondville. From there, it flows generally towards the east-northeast.
The creek eventually joins a larger waterway known as Schoharie Creek. This meeting point is near Central Bridge, New York. Along its path, Cobleskill Creek passes through several towns and villages. These include the village of Richmondville, New York and the town of Cobleskill, New York.
Contents
About Cobleskill Creek
Cobleskill Creek is an important part of the local environment in New York. It helps carry water across the land. This water eventually makes its way to larger rivers and then to the ocean.
Where Does it Start and End?
Every river and creek has a beginning and an end. Cobleskill Creek begins high up at Pine Mountain. This mountain is located in the western part of West Richmondville.
The creek's journey ends when it flows into the Schoharie Creek. This happens near the community of Central Bridge, New York. The point where two rivers meet is called a confluence.
How We Measure the Water
Scientists keep an eye on how much water flows in creeks like Cobleskill Creek. They use special tools called stream gauges. These gauges help them understand the water levels and flow rates.
The United States Geological Survey (USGS) is an agency that studies the Earth. They have set up stream gauges along Cobleskill Creek. One important station is on South Grand Street, near Cobleskill.
Measuring Water Flow Over Time
This particular gauge has been used for many years. It collected data from 1963 to 1965, then again in 1974, 1987, and from 2017 until today. This long record helps scientists see how the creek changes over time.
The gauge measures something called "discharge." This is the volume of water flowing past a point each second. On March 5, 1964, the creek had a very high discharge. It was about 6,570 cubic feet per second. This means a lot of water was moving very fast!
On the other hand, on July 21, 2018, the creek had a very low discharge. It was only about 2.09 cubic feet per second. This shows how much the water flow can change depending on weather and seasons.
 | Audre Lorde |
 | John Berry Meachum |
 | Ferdinand Lee Barnett |


