Cottondale, Alabama facts for kids
Quick facts for kids
Cottondale, Alabama
|
|
|---|---|

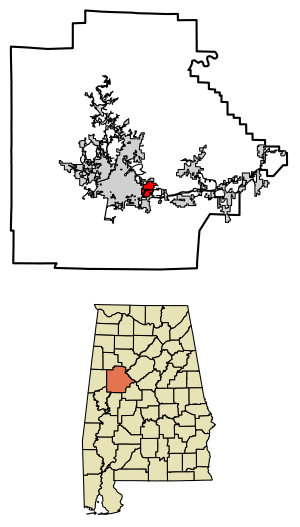
Location of Cottondale in Tuscaloosa County, Alabama.
|
|
| Country | United States |
| State | Alabama |
| County | Tuscaloosa |
| Area | |
| • Total | 3.46 sq mi (8.97 km2) |
| • Land | 3.44 sq mi (8.92 km2) |
| • Water | 0.02 sq mi (0.05 km2) |
| Elevation | 344 ft (105 m) |
| Population
(2020)
|
|
| • Total | 3,130 |
| • Density | 908.83/sq mi (350.94/km2) |
| Time zone | UTC-6 (Central (CST)) |
| • Summer (DST) | UTC-5 (CDT) |
| ZIP code |
35453
|
| Area code(s) | 205, 659 |
| GNIS feature ID | 116690 |
Cottondale is a small community in Tuscaloosa County, Alabama, United States. It's known as a census-designated place, which means it's an area identified by the government for statistics, but it doesn't have its own local government like a city or town. Cottondale is located just east of the larger city of Tuscaloosa.
The area has been called by a few different names over the years. You might hear it referred to as Cotton Dale, Kennedale, Kennidale, or Konnidale. The main ZIP Code for Cottondale is 35453.
Contents
Cottondale's Early History
Cottondale has an interesting past, especially linked to cotton production. The community was once home to large cotton mills. These mills were factories where raw cotton was spun into thread and fabric.
How Cottondale Got Its Name
Originally, this area was called Kennedale. This name honored Joseph Kennedy, who was one of the owners of a local cotton mill. Later, in 1876, the name was changed to Cottondale. This new name clearly showed the importance of the cotton mills to the community.
Workers' Rights and "Mother" Jones
In the late 1800s, groups like the Knights of Labor worked to improve conditions for factory workers in places like Cottondale. They helped organize workers to ask for better pay and safer workplaces.
A famous activist named Mary Harris Jones, often called "Mother" Jones, visited Cottondale in 1904. She was studying the working conditions for women and children in the Southern states. "Mother" Jones was a strong voice for workers' rights. She worked hard to make sure people had fair treatment and safe places to work, especially for young people.
People of Cottondale
Cottondale is a growing community. The government counts the number of people living in places like Cottondale every ten years. This is called a census.
Population in 2020
According to the 2020 census, Cottondale had a population of 3,130 people. This was the first time Cottondale was officially listed as a census-designated place.
 | Emma Amos |
 | Edward Mitchell Bannister |
 | Larry D. Alexander |
 | Ernie Barnes |


