Dover Beaches North, New Jersey facts for kids
Quick facts for kids
Dover Beaches North, New Jersey
|
|
|---|---|
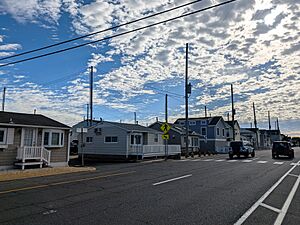
Bungalows in the Monterey Beach section of the CDP
|
|
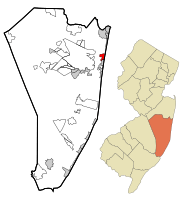
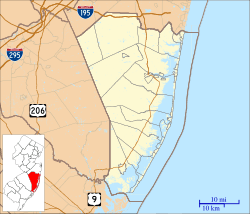
Map of Dover Beaches North CDP in Ocean County. Inset: Location of Ocean County in New Jersey.
|
|
| Country | |
| State | |
| County | Ocean |
| Township | Toms River |
| Area | |
| • Total | 1.58 sq mi (4.09 km2) |
| • Land | 0.92 sq mi (2.38 km2) |
| • Water | 0.66 sq mi (1.71 km2) 41.92% |
| Elevation | 0 ft (0 m) |
| Population
(2020)
|
|
| • Total | 1,277 |
| • Density | 1,388.04/sq mi (536.11/km2) |
| Time zone | UTC−05:00 (Eastern (EST)) |
| • Summer (DST) | UTC−04:00 (Eastern (EDT)) |
| FIPS code | 34-18148 |
| GNIS feature ID | 02389413 |
Dover Beaches North is a special community in Toms River, located in Ocean County, New Jersey. It's known as a census-designated place (CDP), which means it's an area grouped together for population counting.
This community sits on the Barnegat Peninsula. This is a long, narrow strip of land that separates Barnegat Bay from the Atlantic Ocean. In 2020, about 1,277 people lived here.
Dover Beaches North includes several smaller communities. These are Ocean Beaches 1, 2, and 3, Chadwick Beach, Chadwick Island, Seacrest Beach, Monterey Beach, Silver Beach, Normandy Shores, and half of Normandy Beach.
Contents
What is Dover Beaches North?
Dover Beaches North is one of three special areas in Toms River Township. The United States Census Bureau uses these areas to count people. The main part is the Toms River CDP on the mainland. Dover Beaches North and Dover Beaches South are the other two.
Geography of the Area
Dover Beaches North covers a total area of about 1.58 square miles (4.09 square kilometers). Most of this area is land, about 0.92 square miles (2.38 square kilometers). The rest, about 0.66 square miles (1.71 square kilometers), is water. This means about 42% of the area is water.
Who Lives in Dover Beaches North?
The number of people living in Dover Beaches North has changed over the years.
| Historical population | |||
|---|---|---|---|
| Census | Pop. | %± | |
| 2000 | 1,785 | — | |
| 2010 | 1,239 | −30.6% | |
| 2020 | 1,277 | 3.1% | |
| Population sources: 2000-2010 2000 2010 2020 |
|||
Population in 2010
In 2010, there were 1,239 people living in Dover Beaches North. There were 702 households, which are groups of people living together. About 364 of these were families.
Most people living here were White (98.71%). A small number were Black or African American (0.24%), Native American (0.40%), or Asian (0.32%). About 1.94% of the population was Hispanic or Latino.
Many households (43.7%) had just one person living there. About 24.8% of households had someone aged 65 or older living alone. The average household had 1.76 people, and the average family had 2.36 people.
The community has many older residents. About 43.4% of the people were 65 years old or older. The average age was 62.6 years. Only 6.1% of the population was under 18 years old.
History of Dover Beaches North
Dover Beaches North was first settled in the early 1800s. The Chadwick family used it as a place for hunting and fishing.
More buildings were added in 1883. A Coast Guard Lifesaving Station was built to help people in trouble at sea. Also, the Pennsylvania Railroad finished building a train line through the area. It even had a stop at Chadwick Beach.
The area really started to grow after 1913. That's when Route 35 was finished. This road made it much easier for people to visit. The biggest growth as a vacation spot happened in the middle of the 1900s.
In 1961, the old railroad tracks were turned into a new southbound road for Route 35. This allowed the original 1913 road to be used only for northbound traffic.
Today, Dover Beaches North has many private beaches. These beaches are managed by groups of homeowners. There are no public beaches in this area. The private beach communities include:
- Ocean Beach (developed from 1946 to the 1960s, with four sections)
- Brightwater Beach
- Rutherford Beach
- Sunset Manor
- Monterey Beach (started in 1948)
- Seacrest Beach (started in 1954)
- Chadwick Beach
- Silver Beach
- Normandy Beach (started in 1916)
Weather and Climate
Dover Beaches North has a humid subtropical climate. This means it has warm, humid summers and mild to cool winters. All months have an average temperature above freezing (32°F or 0°C).
In summer, a cool sea breeze often blows in the afternoon. However, it can get very hot and humid, with temperatures feeling like 95°F (35°C) or higher. July is usually the wettest month, with many thunderstorms.
In winter, it can get very cold and windy. The wind can make it feel like 0°F (-18°C) or colder. The area usually gets about 18 to 24 inches (46 to 61 cm) of snow each winter. February is often the snowiest month.
The average yearly temperature is about 54°F (12.2°C). The ocean water temperature changes throughout the year. It's coldest in February (around 36°F or 2°C) and warmest in August (around 72°F or 22°C).
| Climate data for Dover Beaches North, NJ (1981-2010 Averages) | |||||||||||||
|---|---|---|---|---|---|---|---|---|---|---|---|---|---|
| Month | Jan | Feb | Mar | Apr | May | Jun | Jul | Aug | Sep | Oct | Nov | Dec | Year |
| Mean daily maximum °F (°C) | 40.3 (4.6) |
42.8 (6.0) |
49.5 (9.7) |
59.3 (15.2) |
69.1 (20.6) |
78.3 (25.7) |
83.4 (28.6) |
82.3 (27.9) |
76.2 (24.6) |
65.5 (18.6) |
55.3 (12.9) |
45.1 (7.3) |
62.3 (16.8) |
| Daily mean °F (°C) | 32.7 (0.4) |
34.8 (1.6) |
41.1 (5.1) |
50.5 (10.3) |
60.3 (15.7) |
69.7 (20.9) |
75.1 (23.9) |
74.0 (23.3) |
67.5 (19.7) |
56.3 (13.5) |
47.0 (8.3) |
37.4 (3.0) |
54.0 (12.2) |
| Mean daily minimum °F (°C) | 25.1 (−3.8) |
26.7 (−2.9) |
32.7 (0.4) |
41.6 (5.3) |
51.4 (10.8) |
61.1 (16.2) |
66.7 (19.3) |
65.8 (18.8) |
58.7 (14.8) |
47.1 (8.4) |
38.8 (3.8) |
29.6 (−1.3) |
45.5 (7.5) |
| Average precipitation inches (mm) | 3.66 (93) |
3.06 (78) |
4.23 (107) |
3.92 (100) |
3.54 (90) |
3.67 (93) |
4.57 (116) |
4.49 (114) |
3.52 (89) |
3.74 (95) |
3.86 (98) |
3.94 (100) |
46.20 (1,173) |
| Average relative humidity (%) | 65.2 | 62.5 | 60.8 | 62.1 | 65.8 | 70.1 | 69.6 | 71.2 | 71.1 | 69.6 | 68.3 | 66.3 | 66.9 |
| Average dew point °F (°C) | 22.3 (−5.4) |
23.3 (−4.8) |
28.6 (−1.9) |
38.0 (3.3) |
48.8 (9.3) |
59.5 (15.3) |
64.5 (18.1) |
64.1 (17.8) |
57.8 (14.3) |
46.5 (8.1) |
37.1 (2.8) |
27.2 (−2.7) |
43.2 (6.2) |
| Source: PRISM | |||||||||||||
| Climate data for Sandy Hook, NJ Ocean Water Temperature (33 N Dover Beaches North) | |||||||||||||
|---|---|---|---|---|---|---|---|---|---|---|---|---|---|
| Month | Jan | Feb | Mar | Apr | May | Jun | Jul | Aug | Sep | Oct | Nov | Dec | Year |
| Daily mean °F (°C) | 37 (3) |
36 (2) |
40 (4) |
46 (8) |
55 (13) |
62 (17) |
69 (21) |
72 (22) |
68 (20) |
59 (15) |
51 (11) |
43 (6) |
53 (12) |
| Source: NOAA | |||||||||||||
Plant Life
The natural plant life in Dover Beaches North would mostly be Cordgrass. This type of grass grows well in coastal areas like prairies near the ocean.
See also
 In Spanish: Dover Beaches North para niños
 | Georgia Louise Harris Brown |
 | Julian Abele |
 | Norma Merrick Sklarek |
 | William Sidney Pittman |


