Ethnic minorities in Azerbaijan facts for kids
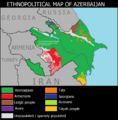
Azerbaijan is a country with a rich history and diverse culture. While most people living there are Azerbaijanis, the country is also home to many different ethnic minorities. These are groups of people who have different cultural backgrounds, languages, or traditions than the main population. Even though their numbers might be small, these groups add to the unique mix of cultures in Azerbaijan.
Who Lives in Azerbaijan?
Azerbaijan has always been a place where many different groups of people live. Besides Azerbaijanis, you can find Russians, Ukrainians, Georgians, Jews, and others. Each group brings its own special customs and ways of life.
Changes Over Time
After the Soviet Union ended and Azerbaijan became independent, some big changes happened. Many people moved around. For example, most Armenians living outside the Nagorno-Karabakh region moved away from Azerbaijan. At the same time, most Azerbaijanis living in Armenia and Nagorno-Karabakh also moved. Over time, many Russians and other minority groups have also left the country. This has made the population of Azerbaijan mostly Azerbaijani.
Looking at the Numbers
The table below shows how the population of different ethnic groups in Azerbaijan has changed over many years, from 1926 to 2009. You can see how the numbers and percentages for each group have shifted.
| Ethnic group |
Census 19261 | Census 19392 | Census 19593 | Census 19704 | Census 19795 | Census 19896 | Census 19996 | Census 2009 | ||||||||
|---|---|---|---|---|---|---|---|---|---|---|---|---|---|---|---|---|
| Number | % | Number | % | Number | % | Number | % | Number | % | Number | % | Number | % | Number | % | |
| Azerbaijanis | 1,437,977 | 62.1 | 1,870,471 | 58.4 | 2,494,381 | 67.5 | 3,776,778 | 73.8 | 4,708,832 | 78.1 | 5,804,980 | 82.7 | 7,205,464 | 90.6 | 8,172,800 | 91.6 |
| Lezgins | 37,263 | 1.6 | 111,666 | 3.5 | 98,211 | 2.7 | 137,250 | 2.7 | 158,057 | 2.6 | 171,395 | 2.4 | 178,021 | 2.2 | 180,300 | 2.02 |
| Armenians | 282,004 | 12.2 | 388,025 | 12.1 | 442,089 | 12.0 | 483,520 | 9.4 | 475,486 | 7.9 | 390,505 | 5.6 | 120,7458 | 1.5 | 120,3008 | 1.35 |
| Russians | 220,545 | 9.5 | 528,318 | 16.5 | 501,282 | 13.6 | 510,059 | 10.0 | 475,255 | 7.9 | 392,304 | 5.6 | 141,687 | 1.8 | 119,300 | 1.35 |
| Talysh | 77,323 | 3.3 | 87,510 | 2.7 | 85 | 0.0 | 21,169 | 0.3 | 76,841 | 1.0 | 112,000 | 1.26 | ||||
| Avars | 19,104 | 0.8 | 15,740 | 0.5 | 17,254 | 0.5 | 30,735 | 0.6 | 35,991 | 0.6 | 44,072 | 0.6 | 50,871 | 0.6 | 49,800 | 0.56 |
| Turks | 95 | 0.0 | 600 | 0.0 | 202 | 0.0 | 8,491 | 0.2 | 7,926 | 0.1 | 17,705 | 0.3 | 43,454 | 0.5 | 38,000 | 0,43 |
| Tatars | 9,948 | 0.4 | 27,591 | 0.9 | 29,370 | 0.8 | 31,353 | 0.6 | 31,204 | 0.5 | 28,019 | 0.4 | 30,011 | 0.4 | 25,900 | 0,29 |
| Tat | 28,443 | 1.2 | 2,289 | 0.1 | 5,887 | 0.2 | 7,769 | 0.2 | 8,848 | 0.1 | 10,239 | 0.1 | 10,922 | 0.1 | 25,200 | 0.28 |
| Ukrainians | 18,241 | 0.8 | 23,643 | 0.7 | 25,778 | 0.7 | 29,160 | 0.6 | 26,402 | 0.4 | 32,345 | 0.5 | 28,984 | 0.4 | 21,500 | 0,24 |
| Tsakhurs | 15,552 | 0.7 | 6,464 | 0.2 | 2,876 | 0.1 | 6,208 | 0.1 | 8,546 | 0.1 | 13,318 | 0.2 | 15,877 | 0.2 | 12,300 | 0.14 |
| Udins | 2,445 | 0.1 | 3,202 | 0.1 | 5,492 | 0.1 | 5,841 | 0.1 | 6,125 | 0.1 | 4,152 | 0.1 | 3,800 | 0.04 | ||
| Georgians | 9,500 | 0.4 | 10,196 | 0.3 | 9,526 | 0.3 | 13,595 | 0.3 | 11,412 | 0.2 | 14,197 | 0.2 | 14,877 | 0.2 | 9,900 | 0.11 |
| Jews | 20,578 | 0.9 | 41,245 | 1.3 | 40,198 | 1.1 | 48,652 | 1.0 | 35,487 | 0.6 | 30,792 | 0.4 | 8,916 | 0.1 | 9,100 | 0.1 |
| Kurds | 41,1937 | 1.8 | 6,005 | 0.2 | 1,487 | 0.0 | 5,488 | 0.1 | 5,676 | 0.1 | 12,226 | 0.2 | 13,075 | 0.2 | 6,100 | 0.07 |
| Others | 94,360 | 4.1 | 85,387 | 2.7 | 25,889 | 0.7 | 22,531 | 0.4 | 31,552 | 0.5 | 31,787 | 0.5 | 9,541 | 0.1 | 9,500 | 0.11 |
| Total | 2,314,571 | 3,205,150 | 3,697,717 | 5,117,081 | 6,026,515 | 7,021,178 | 7,953,438 | 8,922,400 | ||||||||
| 1 Source: [1]. 2 Source: [2]. 3 Source: [3]. 4 Source: [4]. 5 Source: [5]. 6 Source: [6]. 7 Almost all Armenians live in the break-away region of Nagorno-Karabakh since the early 1990s. | ||||||||||||||||
Images for kids
See also
 In Spanish: Minorías étnicas de Azerbaiyán para niños


