Faxon, Oklahoma facts for kids
Quick facts for kids
Faxon, Oklahoma
|
|
|---|---|

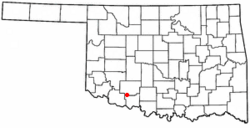
Location of Faxon, Oklahoma
|
|
| Country | United States |
| State | Oklahoma |
| County | Comanche |
| Area | |
| • Total | 0.26 sq mi (0.67 km2) |
| • Land | 0.26 sq mi (0.67 km2) |
| • Water | 0.00 sq mi (0.00 km2) |
| Elevation | 1,083 ft (330 m) |
| Population
(2020)
|
|
| • Total | 114 |
| • Density | 443.58/sq mi (171.32/km2) |
| Time zone | UTC-6 (Central (CST)) |
| • Summer (DST) | UTC-5 (CDT) |
| ZIP code |
73540
|
| Area code(s) | 580 |
| FIPS code | 40-25650 |
| GNIS feature ID | 2412623 |
Faxon is a small town in Comanche County, Oklahoma, United States. It is located on Oklahoma State Highway 36, about 18 miles (29 km) southwest of Lawton. In 2010, the town had a population of 136 people. Faxon is part of the larger Lawton metropolitan area.
Contents
About Faxon's Location
Faxon is a small town, covering about 0.3 square miles (0.78 square kilometers) of land. All of this area is dry land; there are no lakes or rivers within the town limits.
Faxon's Climate
Faxon experiences a climate with warm summers and mild winters. The hottest month is usually July, with average high temperatures around 98°F (37°C). The coldest month is January, where average low temperatures can drop to about 25°F (-4°C). The town gets most of its rain in May and September.
| Climate data for Faxon, Oklahoma | |||||||||||||
|---|---|---|---|---|---|---|---|---|---|---|---|---|---|
| Month | Jan | Feb | Mar | Apr | May | Jun | Jul | Aug | Sep | Oct | Nov | Dec | Year |
| Mean daily maximum °F (°C) | 51.8 (11.0) |
57.5 (14.2) |
67.3 (19.6) |
76.7 (24.8) |
84.5 (29.2) |
92.7 (33.7) |
98.2 (36.8) |
97.1 (36.2) |
88.3 (31.3) |
78.1 (25.6) |
64.4 (18.0) |
54.1 (12.3) |
75.9 (24.4) |
| Mean daily minimum °F (°C) | 25.5 (−3.6) |
30.0 (−1.1) |
38.6 (3.7) |
48.7 (9.3) |
57.6 (14.2) |
66.1 (18.9) |
70.3 (21.3) |
69.0 (20.6) |
62.3 (16.8) |
50.4 (10.2) |
38.9 (3.8) |
28.8 (−1.8) |
48.9 (9.4) |
| Average precipitation inches (mm) | 1.0 (25) |
1.4 (36) |
2.1 (53) |
2.5 (64) |
4.5 (110) |
3.4 (86) |
2.1 (53) |
2.7 (69) |
3.7 (94) |
2.7 (69) |
1.5 (38) |
1.2 (30) |
28.8 (730) |
| Source 1: weather.com | |||||||||||||
| Source 2: Weatherbase.com | |||||||||||||
Population of Faxon
The number of people living in Faxon has changed over the years. Here's a look at the population from different U.S. Censuses:
| Historical population | |||
|---|---|---|---|
| Census | Pop. | %± | |
| 1910 | 215 | — | |
| 1920 | 163 | −24.2% | |
| 1930 | 212 | 30.1% | |
| 1940 | 178 | −16.0% | |
| 1950 | 135 | −24.2% | |
| 1960 | 137 | 1.5% | |
| 1970 | 121 | −11.7% | |
| 1980 | 140 | 15.7% | |
| 1990 | 127 | −9.3% | |
| 2000 | 134 | 5.5% | |
| 2010 | 136 | 1.5% | |
| 2020 | 114 | −16.2% | |
| U.S. Decennial Census | |||
Who Lives in Faxon?
In 2010, there were 136 people living in Faxon. These people lived in 55 different homes, and 39 of these were families. The town had 66 housing units in total.
Most of the people in Faxon (about 89.7%) were White. There were also small groups of African American (0.7%), Native American (4.4%), and Asian (0.7%) residents. About 4.4% of the population identified as being of two or more races. People of Hispanic or Latino background made up 3.7% of the town's population.
Many homes (34.5%) had children under 18 living there. About half of the homes (50.9%) were married couples. Some homes (14.5%) had a female head of household with no husband present. About 29.1% of all homes were individuals living alone. Of these, 18.2% were people aged 65 or older.
The average age of people in Faxon in 2010 was 44.5 years. About 28.7% of the population was under 18. About 17.6% were 65 years or older. For every 100 females, there were about 83.8 males.
Income in Faxon
In 2000, the average income for a household in Faxon was $25,000 per year. For families, the average income was $31,250. Men generally earned more than women. The average income per person in the town was $13,630. About 13.8% of the population lived below the poverty line. This included 13.2% of those under 18 and 5.9% of those over 64.
See also
 In Spanish: Faxon (Oklahoma) para niños
 | Lonnie Johnson |
 | Granville Woods |
 | Lewis Howard Latimer |
 | James West |

