
Fleming, Colorado facts for kids
Quick facts for kids
Fleming, Colorado
|
|
|---|---|
| Town of Fleming | |

Entering Fleming from the west.
|
|

Location of the Town of Fleming in Logan County, Colorado.
|
|

Fleming, Colorado
Location in the United States
|
|
| Country | |
| State | |
| County | Logan County |
| Incorporated (town) | May 5, 1917 |
| Government | |
| • Type | Statutory Town |
| Area | |
| • Total | 0.489 sq mi (1.267 km2) |
| • Land | 0.489 sq mi (1.267 km2) |
| • Water | 0 sq mi (0.000 km2) |
| Elevation | 4,242 ft (1,293 m) |
| Population
(2020)
|
|
| • Total | 428 |
| • Density | 875/sq mi (338/km2) |
| • Metro | 21,528 |
| Time zone | UTC−07:00 (MST) |
| • Summer (DST) | UTC−06:00 (MDT) |
| ZIP code |
80728
|
| Area code(s) | 970 |
| FIPS code | 08-26875 |
| GNIS feature ID | 0204718 |
The Town of Fleming is a small town in Logan County, Colorado, United States. It's known as a "statutory town," which means it follows specific state laws for towns. In 2020, about 428 people lived in Fleming. It's also part of a larger area called the Sterling, CO Micropolitan Statistical Area.
Contents
History of Fleming
The town of Fleming got its name from a man named Henry Bascom Fleming. He was an important official who worked for the railroad.
Geography and Location
Fleming is located in northeastern Colorado. You can find it on a map at these coordinates: 40 degrees, 40 minutes, 58 seconds North and 102 degrees, 50 minutes, 24 seconds West.
Size of the Town
According to the 2020 United States Census, the town covers a total area of about 1.267 square kilometers. All of this area is land, with no large bodies of water inside the town limits.
Climate in Fleming
Fleming has a semi-arid climate. This means it's usually dry, but not a true desert. It gets some rain, but not a lot. On climate maps, this type of weather is often called "BSk."
| Climate data for Fleming, Colorado, 1991–2020 normals, extremes 1998–present | |||||||||||||
|---|---|---|---|---|---|---|---|---|---|---|---|---|---|
| Month | Jan | Feb | Mar | Apr | May | Jun | Jul | Aug | Sep | Oct | Nov | Dec | Year |
| Record high °F (°C) | 74 (23) |
78 (26) |
85 (29) |
92 (33) |
99 (37) |
109 (43) |
107 (42) |
106 (41) |
103 (39) |
93 (34) |
83 (28) |
77 (25) |
109 (43) |
| Mean maximum °F (°C) | 61.7 (16.5) |
67.0 (19.4) |
77.9 (25.5) |
84.3 (29.1) |
91.0 (32.8) |
100.3 (37.9) |
102.3 (39.1) |
99.9 (37.7) |
95.6 (35.3) |
87.9 (31.1) |
76.5 (24.7) |
64.1 (17.8) |
103.8 (39.9) |
| Mean daily maximum °F (°C) | 41.7 (5.4) |
44.3 (6.8) |
54.3 (12.4) |
61.6 (16.4) |
71.1 (21.7) |
83.1 (28.4) |
90.0 (32.2) |
88.3 (31.3) |
80.2 (26.8) |
65.4 (18.6) |
52.0 (11.1) |
42.2 (5.7) |
64.5 (18.1) |
| Daily mean °F (°C) | 29.4 (−1.4) |
31.6 (−0.2) |
40.4 (4.7) |
47.6 (8.7) |
57.9 (14.4) |
69.0 (20.6) |
75.6 (24.2) |
73.4 (23.0) |
64.9 (18.3) |
50.9 (10.5) |
38.8 (3.8) |
29.8 (−1.2) |
50.8 (10.5) |
| Mean daily minimum °F (°C) | 17.1 (−8.3) |
18.8 (−7.3) |
26.6 (−3.0) |
33.6 (0.9) |
44.6 (7.0) |
54.9 (12.7) |
61.2 (16.2) |
58.5 (14.7) |
49.5 (9.7) |
36.4 (2.4) |
25.5 (−3.6) |
17.4 (−8.1) |
37.0 (2.8) |
| Mean minimum °F (°C) | −6.4 (−21.3) |
−4.7 (−20.4) |
7.9 (−13.4) |
16.9 (−8.4) |
28.4 (−2.0) |
41.0 (5.0) |
50.8 (10.4) |
46.9 (8.3) |
35.4 (1.9) |
18.0 (−7.8) |
7.1 (−13.8) |
−7.5 (−21.9) |
−13.7 (−25.4) |
| Record low °F (°C) | −20 (−29) |
−26 (−32) |
−15 (−26) |
6 (−14) |
18 (−8) |
33 (1) |
46 (8) |
39 (4) |
28 (−2) |
5 (−15) |
−13 (−25) |
−23 (−31) |
−26 (−32) |
| Average precipitation inches (mm) | 0.25 (6.4) |
0.40 (10) |
0.90 (23) |
1.81 (46) |
3.09 (78) |
2.49 (63) |
2.60 (66) |
2.17 (55) |
1.28 (33) |
1.28 (33) |
0.51 (13) |
0.40 (10) |
17.18 (436.4) |
| Average snowfall inches (cm) | 3.7 (9.4) |
7.4 (19) |
4.8 (12) |
5.1 (13) |
1.2 (3.0) |
0.2 (0.51) |
0.0 (0.0) |
0.0 (0.0) |
0.2 (0.51) |
3.1 (7.9) |
4.4 (11) |
6.9 (18) |
37.0 (94) |
| Average precipitation days (≥ 0.01 in) | 2.7 | 4.0 | 4.4 | 6.7 | 8.8 | 7.6 | 7.5 | 6.5 | 5.2 | 5.0 | 3.3 | 3.4 | 65.1 |
| Average snowy days (≥ 0.1 in) | 3.7 | 5.0 | 3.3 | 2.5 | 0.5 | 0.1 | 0.0 | 0.0 | 0.1 | 1.2 | 2.9 | 4.3 | 23.6 |
| Source 1: NOAA | |||||||||||||
| Source 2: National Weather Service (mean maxima and minima 2006–2020) | |||||||||||||
People in Fleming
| Historical population | |||
|---|---|---|---|
| Census | Pop. | %± | |
| 1920 | 518 | — | |
| 1930 | 365 | −29.5% | |
| 1940 | 400 | 9.6% | |
| 1950 | 377 | −5.7% | |
| 1960 | 384 | 1.9% | |
| 1970 | 349 | −9.1% | |
| 1980 | 388 | 11.2% | |
| 1990 | 344 | −11.3% | |
| 2000 | 426 | 23.8% | |
| 2010 | 408 | −4.2% | |
| 2020 | 428 | 4.9% | |
| U.S. Decennial Census | |||
The United States Census helps us learn about the people living in Fleming.
Population Over Time
The number of people living in Fleming has changed over the years. In 1920, there were 518 residents. By 2020, the population was 428 people.
Who Lives in Fleming?
In 2000, there were 426 people living in Fleming. These people lived in 169 different homes. Most of the people were White. A small number were African American or Native American. Some people were of Hispanic or Latino background.
Many homes had families, including married couples. About 30% of homes had children under 18 living there. The average age of people in Fleming was 39 years old. About 29% of the population was under 18. About 19% were 65 years or older.
See also
 In Spanish: Fleming (Colorado) para niños
Images for kids
-
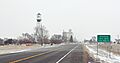
Entering Fleming from the west.
-
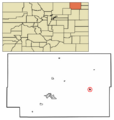
Location of the Town of Fleming in Logan County, Colorado.
