Follett, Texas facts for kids
Quick facts for kids
Follett, Texas
|
|
|---|---|

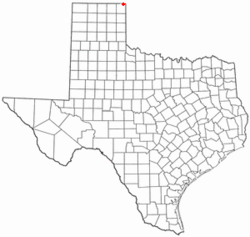
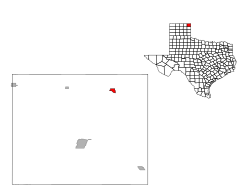
Location of Follett, Texas
|
|
 |
|
| Country | United States |
| State | Texas |
| County | Lipscomb |
| Area | |
| • Total | 0.97 sq mi (2.52 km2) |
| • Land | 0.97 sq mi (2.52 km2) |
| • Water | 0.00 sq mi (0.00 km2) |
| Elevation | 2,608 ft (795 m) |
| Population
(2020)
|
|
| • Total | 373 |
| • Density | 384.5/sq mi (148.0/km2) |
| Time zone | UTC-6 (Central (CST)) |
| • Summer (DST) | UTC-5 (CDT) |
| ZIP code |
79034
|
| Area code(s) | 806 |
| FIPS code | 48-26328 |
| GNIS feature ID | 2410515 |
Follett is a small city located in Lipscomb County, Texas, in the United States. It was founded in 1917. A railroad official named Thomas C. Spearman established it as a townsite. The town was named after Horace Follett, an engineer who helped plan the railway line. In 2020, the population of Follett was 373 people.
Geography of Follett
Follett is located in the state of Texas. According to the United States Census Bureau, the city covers a total area of about 1.0 square mile (2.52 square kilometers). All of this area is land.
Follett's Climate
Follett has a semi-arid climate. This means it is generally dry, but not a desert. It often has hot summers and cold winters. On climate maps, this type of weather is called "BSk."
The hottest temperature ever recorded in Follett was 112°F (44°C). This happened on July 20, 2022. The coldest temperature recorded was -18°F (-28°C) on December 22, 1989.
| Climate data for Follett, Texas, 1991–2020 normals, extremes 1934–present | |||||||||||||
|---|---|---|---|---|---|---|---|---|---|---|---|---|---|
| Month | Jan | Feb | Mar | Apr | May | Jun | Jul | Aug | Sep | Oct | Nov | Dec | Year |
| Record high °F (°C) | 82 (28) |
93 (34) |
97 (36) |
98 (37) |
104 (40) |
111 (44) |
112 (44) |
110 (43) |
107 (42) |
102 (39) |
90 (32) |
84 (29) |
112 (44) |
| Mean maximum °F (°C) | 71.4 (21.9) |
77.2 (25.1) |
84.8 (29.3) |
89.7 (32.1) |
93.8 (34.3) |
99.1 (37.3) |
101.7 (38.7) |
101.3 (38.5) |
96.4 (35.8) |
90.6 (32.6) |
78.5 (25.8) |
70.4 (21.3) |
103.7 (39.8) |
| Mean daily maximum °F (°C) | 48.6 (9.2) |
52.6 (11.4) |
62.2 (16.8) |
70.9 (21.6) |
79.8 (26.6) |
88.7 (31.5) |
93.3 (34.1) |
92.2 (33.4) |
84.6 (29.2) |
72.5 (22.5) |
60.2 (15.7) |
49.4 (9.7) |
71.3 (21.8) |
| Daily mean °F (°C) | 35.7 (2.1) |
38.8 (3.8) |
47.5 (8.6) |
56.0 (13.3) |
66.0 (18.9) |
75.5 (24.2) |
80.1 (26.7) |
78.9 (26.1) |
71.2 (21.8) |
58.8 (14.9) |
46.6 (8.1) |
37.0 (2.8) |
57.7 (14.3) |
| Mean daily minimum °F (°C) | 22.8 (−5.1) |
25.0 (−3.9) |
32.9 (0.5) |
41.0 (5.0) |
52.2 (11.2) |
62.3 (16.8) |
66.9 (19.4) |
65.6 (18.7) |
57.8 (14.3) |
45.0 (7.2) |
32.9 (0.5) |
24.7 (−4.1) |
44.1 (6.7) |
| Mean minimum °F (°C) | 6.0 (−14.4) |
8.7 (−12.9) |
15.8 (−9.0) |
26.6 (−3.0) |
37.1 (2.8) |
51.0 (10.6) |
58.2 (14.6) |
56.7 (13.7) |
43.3 (6.3) |
27.5 (−2.5) |
16.9 (−8.4) |
7.8 (−13.4) |
1.1 (−17.2) |
| Record low °F (°C) | −12 (−24) |
−15 (−26) |
−4 (−20) |
12 (−11) |
28 (−2) |
42 (6) |
46 (8) |
47 (8) |
29 (−2) |
7 (−14) |
3 (−16) |
−18 (−28) |
−18 (−28) |
| Average precipitation inches (mm) | 0.80 (20) |
0.74 (19) |
1.74 (44) |
2.08 (53) |
3.12 (79) |
3.45 (88) |
2.74 (70) |
2.54 (65) |
2.12 (54) |
2.15 (55) |
0.94 (24) |
0.82 (21) |
23.24 (592) |
| Average snowfall inches (cm) | 2.8 (7.1) |
1.1 (2.8) |
3.5 (8.9) |
0.1 (0.25) |
0.0 (0.0) |
0.0 (0.0) |
0.0 (0.0) |
0.0 (0.0) |
0.0 (0.0) |
0.7 (1.8) |
2.2 (5.6) |
2.7 (6.9) |
13.1 (33.35) |
| Average extreme snow depth inches (cm) | 0.9 (2.3) |
0.9 (2.3) |
0.4 (1.0) |
0.1 (0.25) |
0.0 (0.0) |
0.0 (0.0) |
0.0 (0.0) |
0.0 (0.0) |
0.0 (0.0) |
0.0 (0.0) |
0.4 (1.0) |
0.7 (1.8) |
1.8 (4.6) |
| Average precipitation days (≥ 0.01 in) | 2.5 | 3.3 | 4.7 | 5.1 | 6.7 | 6.5 | 6.5 | 6.5 | 4.2 | 4.4 | 3.2 | 3.4 | 57.0 |
| Average snowy days (≥ 0.1 in) | 0.9 | 0.7 | 0.8 | 0.0 | 0.0 | 0.0 | 0.0 | 0.0 | 0.0 | 0.2 | 0.5 | 0.9 | 4.0 |
| Source 1: NOAA | |||||||||||||
| Source 2: National Weather Service | |||||||||||||
People of Follett
| Historical population | |||
|---|---|---|---|
| Census | Pop. | %± | |
| 1930 | 658 | — | |
| 1940 | 431 | −34.5% | |
| 1950 | 540 | 25.3% | |
| 1960 | 466 | −13.7% | |
| 1970 | 522 | 12.0% | |
| 1980 | 547 | 4.8% | |
| 1990 | 441 | −19.4% | |
| 2000 | 412 | −6.6% | |
| 2010 | 459 | 11.4% | |
| 2020 | 373 | −18.7% | |
| U.S. Decennial Census 2020 Census |
|||
In 2000, there were 412 people living in Follett. These people lived in 174 households. About 112 of these households were families. The city had 242 housing units in total.
Most of the people in Follett were White (91.75%). Some were Native American (1.46%). About 6.07% were from other racial backgrounds. A small number (0.73%) were from two or more races. About 7.28% of the population identified as Hispanic or Latino.
About 28.2% of households had children under 18 living there. More than half (56.9%) were married couples. Some households (6.9%) had a female head without a husband. About 35.1% were not families.
Many households (33.3%) had only one person living in them. About 21.8% of these single-person households were people aged 65 or older. The average household had 2.37 people. The average family had 3.04 people.
The population's age was spread out. About 26.5% were under 18 years old. About 19.7% were 65 years or older. The average age in Follett was 42 years. For every 100 females, there were about 90 males.
Education in Follett
The city of Follett is served by the Follett Independent School District. This school district provides education for the children living in the town.
See also
 In Spanish: Follett (Texas) para niños
 | Bessie Coleman |
 | Spann Watson |
 | Jill E. Brown |
 | Sherman W. White |

