
Frequency (statistics) facts for kids
In statistics, frequency (also called absolute frequency) is simply how many times something happens or is recorded in a study or experiment. Imagine you're counting how many times your favorite song plays on the radio in an hour. That count is the frequency! We often show these counts using graphs or tables to make them easy to understand.
Contents
Types of Frequency
When we talk about frequency, there are a few different types:
- The cumulative frequency is like a running total. It's the sum of all frequencies up to a certain point in an ordered list. For example, if you list test scores from lowest to highest, the cumulative frequency for a score of 80 would be the number of students who scored 80 or less.
- The relative frequency is the absolute frequency turned into a fraction or percentage. It tells you how often something happens compared to the total number of things that happened. You find it by dividing the number of times an event occurred by the total number of events.
For example, if your favorite song played 5 times in 100 songs, its relative frequency is 5/100, or 0.05 (which is 5%).
We can write this as: 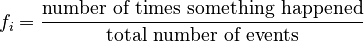
When you plot these relative frequencies for all events, you get a frequency distribution.
Showing Frequency Distributions
A frequency distribution is a way to organize and summarize data. It groups data into different categories or ranges and shows how many times each category appears. This helps us see patterns in unorganized data, like how many people voted for a certain candidate, how much money people in a region earn, or how many products were sold.
You can show frequency distributions using different types of graphs, such as histograms, line charts, bar charts, and pie charts. Frequency distributions are used for both data that can be counted (like the number of cars) and data that describes qualities (like colors).


How to Make a Frequency Distribution
Here are the basic steps to create a frequency distribution:
- Decide on the number of groups (classes): You need to choose how many groups you want to divide your data into. Too many or too few groups can make it hard to understand the data.
- Find the range of your data: This is the difference between the highest and lowest values in your data set.
- Decide the width of each group: If you want all your groups to be the same size, you can divide the range by the number of groups you chose.
- Set the limits for each group: Choose where each group starts and ends. The first group's starting point can be less than or equal to your lowest data value.
- Tally the observations: Go through your data one by one. For each piece of data, make a mark (like a vertical bar) next to the group it belongs to. Keep a running count until you've gone through all your data.
- Count the frequencies: Once you've tallied everything, count the marks for each group to find its frequency. You can then calculate relative frequency or cumulative frequency if needed.
Histograms
A histogram is a special type of bar graph used to show frequencies of continuous data. The bars in a histogram touch each other because the data ranges are continuous. The height of each bar shows how many observations fall into that specific range. The wider the bar, the more data points it represents.
Bar Graphs
A bar chart or bar graph uses rectangular bars to show values. The length of each bar is proportional to the value it represents. Bars can be drawn vertically or horizontally. Unlike histograms, the bars in a bar graph usually don't touch each other, especially when showing categories that aren't continuous.
Frequency Distribution Tables
A frequency distribution table is a simple way to organize data. It lists the different values or groups of values that a variable can take, and then shows how many times each value or group appears. This helps summarize the data's distribution.
Here's an example of a table showing survey responses:
| Rank | Degree of agreement | Number |
|---|---|---|
| 1 | Strongly agree | 22 |
| 2 | Agree somewhat | 30 |
| 3 | Not sure | 20 |
| 4 | Disagree somewhat | 15 |
| 5 | Strongly disagree | 15 |
Another example shows student heights grouped into ranges:
| Height range | Number of students | Cumulative number |
|---|---|---|
| less than 5.0 feet | 25 | 25 |
| 5.0–5.5 feet | 35 | 60 |
| 5.5–6.0 feet | 20 | 80 |
| 6.0–6.5 feet | 20 | 100 |
Joint Frequency Distributions
Sometimes, you want to see how two different variables relate to each other. A joint frequency distribution, often shown as a contingency table, does this. It shows the frequencies for combinations of two variables.
Here's an example showing how many men and women prefer different activities:
| Dance | Sports | TV | Total | |
|---|---|---|---|---|
| Men | 2 | 10 | 8 | 20 |
| Women | 16 | 6 | 8 | 30 |
| Total | 18 | 16 | 16 | 50 |
The "Total" row and column show the overall frequencies for each activity or gender, while the numbers inside the table show the frequencies for specific combinations (like men who like dance).
Why Frequencies are Useful
Working with data organized into frequency tables is much easier than dealing with raw, unorganized data. You can quickly calculate things like the average (mean) or the middle value (median) from these tables.
Frequency distributions are also super important in statistics for comparing different groups of data. For example, you can use them to see if there's a big difference between the test scores of two different classes.
Frequencies are even used to crack secret codes! In frequency analysis, people study how often each letter appears in a coded message. Since some letters (like 'E' in English) appear more often than others, this can help them figure out the code.
See also
 In Spanish: Frecuencia estadística para niños
- Aperiodic frequency
- Count data
- Cross tabulation
- Cumulative distribution function
- Cumulative frequency analysis
- Empirical distribution function
- Law of large numbers
- Multiset multiplicity as frequency analog
- Probability density function
- Probability interpretations
- Statistical regularity
- Word frequency
