Friona, Texas facts for kids
Quick facts for kids
Friona, Texas
|
|
|---|---|
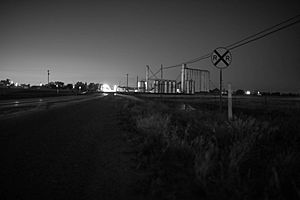
Friona at dusk
|
|
| Motto(s):
"The Biggest Small Town in Texas"
|
|
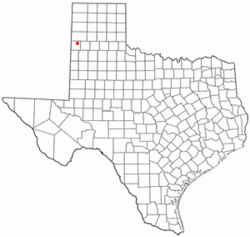
Location of Friona, Texas
|
|
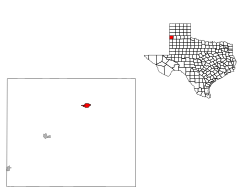 |
|
| Country | United States |
| State | Texas |
| County | Parmer |
| Government | |
| • Type | Council-manager |
| Area | |
| • Total | 1.40 sq mi (3.63 km2) |
| • Land | 1.40 sq mi (3.63 km2) |
| • Water | 0.00 sq mi (0.00 km2) |
| Elevation | 4,019 ft (1,225 m) |
| Population
(2020)
|
|
| • Total | 4,171 |
| • Density | 2,979.29/sq mi (1,150.31/km2) |
| Time zone | UTC-6 (Central (CST)) |
| • Summer (DST) | UTC-5 (CDT) |
| ZIP code |
79035
|
| Area code(s) | 806 |
| FIPS code | 48-27660 |
| GNIS feature ID | 1357767 |
Friona is a city located in Parmer County, Texas, in the United States. In 2020, about 4,171 people lived there.
Friona started as a small community in 1898. It was founded by the XIT Ranch. The original name was Frio, which means "cold" in Spanish.
The community became an important shipping spot for railroads. In 1906, a company called George G. Wright Land CO. chose Friona for a new settlement project. They promised settlers good soil and a healthy climate. The town officially became Friona when a post office opened on March 16, 1907. Soon, buildings like a hotel, a stable, and a bank were built. The first church was constructed, followed by a school in 1908.
In 2007, the Texas State Legislature gave Friona a special title. They declared it the "Cheeseburger Capital of Texas." The city has celebrated this with a "Cheeseburger Cook-Off and Festival" since 2006. Friona's city motto is "The Biggest Small Town in Texas."
Geography
Friona is located in Texas at coordinates 34.638987° N and 102.721571° W. The city covers a total area of about 1.4 square miles (3.6 square kilometers). All of this area is land, with no water.
Climate
Friona has a semiarid climate. This means it is generally dry, but not a desert. It gets some rain, but not a lot. The climate is classified as BSk on climate maps.
| Climate data for Friona, Texas (1991–2020 normals, extremes 1962–present) | |||||||||||||
|---|---|---|---|---|---|---|---|---|---|---|---|---|---|
| Month | Jan | Feb | Mar | Apr | May | Jun | Jul | Aug | Sep | Oct | Nov | Dec | Year |
| Record high °F (°C) | 80 (27) |
83 (28) |
91 (33) |
97 (36) |
100 (38) |
109 (43) |
107 (42) |
106 (41) |
104 (40) |
96 (36) |
86 (30) |
79 (26) |
109 (43) |
| Mean maximum °F (°C) | 69.9 (21.1) |
74.9 (23.8) |
82.3 (27.9) |
87.1 (30.6) |
94.0 (34.4) |
100.1 (37.8) |
100.0 (37.8) |
98.1 (36.7) |
95.2 (35.1) |
88.8 (31.6) |
78.7 (25.9) |
70.2 (21.2) |
102.7 (39.3) |
| Mean daily maximum °F (°C) | 50.9 (10.5) |
56.0 (13.3) |
64.3 (17.9) |
72.0 (22.2) |
80.3 (26.8) |
89.4 (31.9) |
91.2 (32.9) |
89.9 (32.2) |
83.5 (28.6) |
73.0 (22.8) |
60.3 (15.7) |
51.0 (10.6) |
71.8 (22.1) |
| Daily mean °F (°C) | 36.7 (2.6) |
40.5 (4.7) |
48.0 (8.9) |
55.2 (12.9) |
64.7 (18.2) |
74.3 (23.5) |
77.3 (25.2) |
76.0 (24.4) |
69.1 (20.6) |
57.7 (14.3) |
45.4 (7.4) |
37.3 (2.9) |
56.9 (13.8) |
| Mean daily minimum °F (°C) | 22.4 (−5.3) |
25.1 (−3.8) |
31.7 (−0.2) |
38.4 (3.6) |
49.0 (9.4) |
59.2 (15.1) |
63.4 (17.4) |
62.1 (16.7) |
54.6 (12.6) |
42.3 (5.7) |
30.5 (−0.8) |
23.6 (−4.7) |
41.9 (5.5) |
| Mean minimum °F (°C) | 9.5 (−12.5) |
11.0 (−11.7) |
17.1 (−8.3) |
26.3 (−3.2) |
36.1 (2.3) |
50.0 (10.0) |
57.8 (14.3) |
56.0 (13.3) |
43.4 (6.3) |
27.9 (−2.3) |
16.2 (−8.8) |
8.3 (−13.2) |
4.2 (−15.4) |
| Record low °F (°C) | −15 (−26) |
−13 (−25) |
5 (−15) |
16 (−9) |
24 (−4) |
42 (6) |
51 (11) |
47 (8) |
29 (−2) |
13 (−11) |
2 (−17) |
−9 (−23) |
−15 (−26) |
| Average precipitation inches (mm) | 0.70 (18) |
0.48 (12) |
1.15 (29) |
1.00 (25) |
2.14 (54) |
2.49 (63) |
2.64 (67) |
3.13 (80) |
2.03 (52) |
1.98 (50) |
0.75 (19) |
0.80 (20) |
19.29 (490) |
| Average snowfall inches (cm) | 2.5 (6.4) |
2.4 (6.1) |
1.4 (3.6) |
0.5 (1.3) |
0.0 (0.0) |
0.0 (0.0) |
0.0 (0.0) |
0.0 (0.0) |
0.0 (0.0) |
0.6 (1.5) |
1.9 (4.8) |
3.7 (9.4) |
13.0 (33) |
| Average precipitation days (≥ 0.01 in) | 3.2 | 3.3 | 4.2 | 4.4 | 6.3 | 7.1 | 6.5 | 8.2 | 5.4 | 5.2 | 3.1 | 3.7 | 60.6 |
| Average snowy days (≥ 0.1 in) | 1.6 | 1.4 | 0.8 | 0.2 | 0.0 | 0.0 | 0.0 | 0.0 | 0.0 | 0.3 | 0.9 | 1.6 | 6.8 |
| Source: NOAA | |||||||||||||
Population and People
| Historical population | |||
|---|---|---|---|
| Census | Pop. | %± | |
| 1930 | 731 | — | |
| 1940 | 803 | 9.8% | |
| 1950 | 1,202 | 49.7% | |
| 1960 | 2,048 | 70.4% | |
| 1970 | 3,111 | 51.9% | |
| 1980 | 3,809 | 22.4% | |
| 1990 | 3,688 | −3.2% | |
| 2000 | 3,854 | 4.5% | |
| 2010 | 4,123 | 7.0% | |
| 2020 | 4,171 | 1.2% | |
| U.S. Decennial Census | |||
The population of Friona has grown over the years. In 1930, there were 731 people. By 2020, the population had increased to 4,171.
2020 Census Information
In 2020, the city had 4,171 people living in 1,409 households. These households included 1,084 families.
| Race | Number | Percentage |
|---|---|---|
| White (NH) | 714 | 17.12% |
| Black or African American (NH) | 26 | 0.62% |
| Native American or Alaska Native (NH) | 1 | 0.02% |
| Asian (NH) | 7 | 0.17% |
| Some Other Race (NH) | 19 | 0.46% |
| Mixed/Multi-Racial (NH) | 32 | 0.77% |
| Hispanic or Latino | 3,372 | 80.84% |
| Total | 4,171 |
Most of the people in Friona are of Hispanic or Latino background. About 80.84% of the population identifies as Hispanic or Latino. The rest of the population includes White, Black, Native American, Asian, and people of mixed races.
Education
Friona is known for an important moment in education history. In 1954, after the Brown v. Board of Education court case, Friona was the first school in Texas to allow Black students to attend with White students. This was a big step towards equal education.
The city's schools are part of the Friona Independent School District. The high school's sports teams are called the Chieftains. Their school colors are red and white.
See also
 In Spanish: Friona (Texas) para niños
 | Anna J. Cooper |
 | Mary McLeod Bethune |
 | Lillie Mae Bradford |

